

Mathematics, 15.12.2020 18:30, shahedalahmad2017
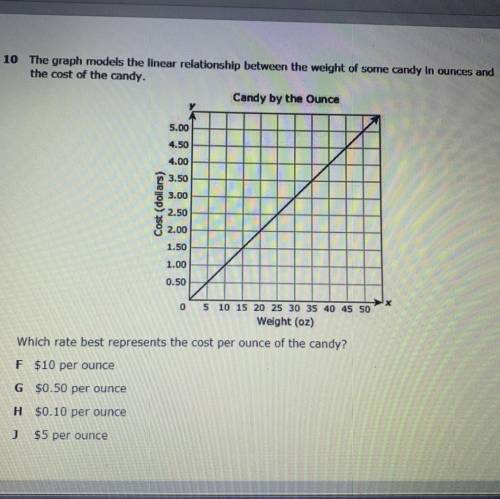
10 The graph models the linear relationship between the weight of some candy in ounces and
the cost of the candy.
Candy by the Ounce
5.00
4.50
4.00
3.50
3.00
Cost (dollars)
2.50
2.00
1.50
1.00
0.50
0 5 10 15 20 25 30 35 40 45 50
Weight (oz)
Which rate best represents the cost per ounce of the candy?
F $10 per ounce
G $0.50 per ounce
H $0.10 per ounce
J $5 per ounce

Answers: 3


Other questions on the subject: Mathematics
Mathematics, 21.06.2019 14:40, hannamcbrayer1
Which statement most accurately describe why the division property of exponents does not apply to the expression (-8)^2/(-3)^4
Answers: 2
Mathematics, 21.06.2019 19:30, pillgiing
Acar started driving from city a to city b, distance between which is 620 miles, at a rate of 60 mph. two hours later a truck left city b and started moving towards city a at a rate of 40 mph. what distance from city a is the point where the truck and the car will meet?
Answers: 1
Mathematics, 21.06.2019 19:50, nawafcanada
On a piece of paper graft y+2> -3x-3 then determine which answer matches the graph you drew
Answers: 2
Do you know the correct answer?
10 The graph models the linear relationship between the weight of some candy in ounces and
the cost...
Questions in other subjects:
Mathematics, 19.02.2021 19:10
Mathematics, 19.02.2021 19:10
Mathematics, 19.02.2021 19:10


Social Studies, 19.02.2021 19:10

Biology, 19.02.2021 19:10
Mathematics, 19.02.2021 19:10


