

Mathematics, 15.12.2020 16:20, jadenp23
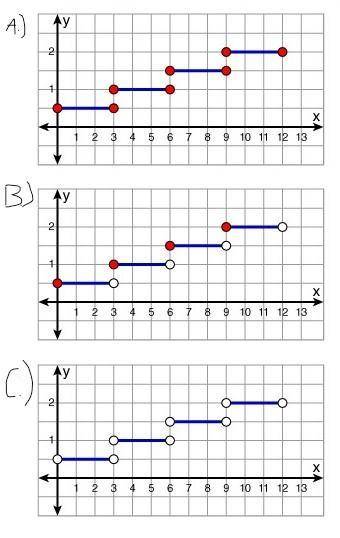
The hourly wage increase each employee receives each year depends on their number of years of service.
Every three years of service means an increase of $0.50 per hour. So, employees that have been with the company for less than three years can expect to receive an increase of $0.50 per hour. Employees that have been with the company for at least three years, but less than six years can expect an increase of $1.00. Employees that have been with the company for at six years, but less than nine years, receive an increase of $1.50 per hour. And, employees of at least nine years, but less than twelve years receive an increase of $2.00.
Which graph represents this wage increase for x < 12?

Answers: 2


Other questions on the subject: Mathematics
Mathematics, 21.06.2019 23:30, byron17
Select the correct answer from each drop-down menu. james needs to clock a minimum of 9 hours per day at work. the data set records his daily work hours, which vary between 9 hours and 12 hours, for a certain number of days. {9, 9.5, 10, 10.5, 10.5, 11, 11, 11.5, 11.5, 11.5, 12, 12}. the median number of hours james worked is . the skew of the distribution is
Answers: 3
Do you know the correct answer?
The hourly wage increase each employee receives each year depends on their number of years of servic...
Questions in other subjects:

History, 16.10.2019 20:00
History, 16.10.2019 20:00


English, 16.10.2019 20:00
History, 16.10.2019 20:00


