

Mathematics, 15.12.2020 01:10, jakobcook7pdvy6d
Select the correct answer.
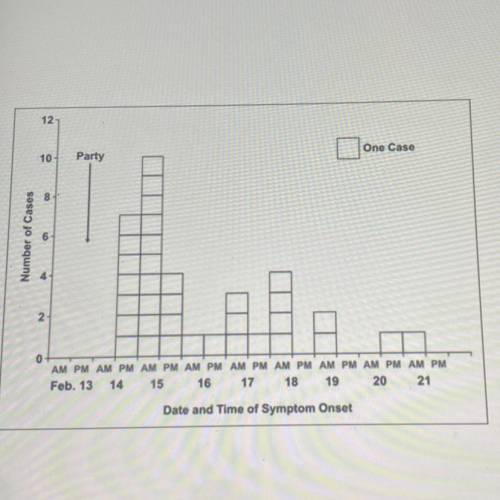
The graph shows the number of cases of people developing salmonella symptoms at different
times of a fixed number of days,
According to the graph, when were people most likely to develop salmonella symptoms?
A. February 14, p. m,
B. February 15, p. m
C. February 15, a. m.
D. February 18, a. m.
E. February 18, p. m

Answers: 1


Other questions on the subject: Mathematics
Mathematics, 20.06.2019 18:04, biancabahena04
Asmall car averages up to 29 more miles per gallon of gas that an suv. if a small car averages 44 miles per gallon, what is the average miles per gallon for an suv?
Answers: 2
Mathematics, 21.06.2019 14:00, haydencheramie
In the diagram, the measure of angle 9 is 85° which angle must also measure 85°?
Answers: 3
Mathematics, 21.06.2019 19:00, sreyasusanbinu
45% of the trees in a park are apple trees. there are 27 apple trees in the park. how many trees are in the park in all?
Answers: 1
Do you know the correct answer?
Select the correct answer.
The graph shows the number of cases of people developing salmonella symp...
Questions in other subjects:

History, 01.04.2020 21:20

Social Studies, 01.04.2020 21:20


Biology, 01.04.2020 21:20

Mathematics, 01.04.2020 21:20


