

Mathematics, 14.12.2020 23:00, amoryfe28p0vpwo
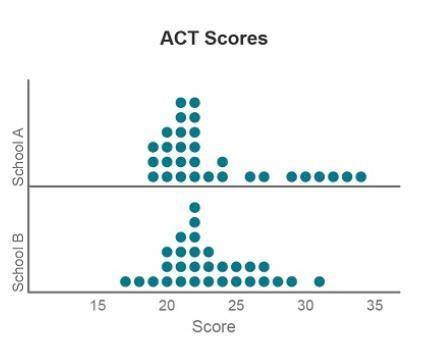
A school district wanted to compare ACT scores between two of its schools (school A and school B). The dotplots below summarize the ACT scores for simple random samples of 30 students from each school.
The median score was 22 for both samples. Which of the following statements is true about the mean ACT for each sample?
A) The mean score for the sample from school A is equal to the mean score for the sample from school B.
B) The mean score for the sample from school A is less than the mean score for the sample from school B.
C) The mean score for the sample from school A is greater than the mean score for the sample from school B.
D) We cannot determine the relationship between the mean ACT scores without knowing the actual scores on the exam.

Answers: 1


Other questions on the subject: Mathematics
Mathematics, 21.06.2019 19:50, gymnastattack
Drag each tile into the correct box. not all tiles will be used. find the tables with unit rates greater than the unit rate in the graph. then tenge these tables in order from least to greatest unit rate
Answers: 2
Mathematics, 21.06.2019 20:30, aavil5659
Clarence wants to buy a new car. he finds an ad for a car that costs 27,200 dollars. suppose his local sales tax is 7%. -how much would he have to pay? -what is the cost of the car including tax? -if clarence has 29,864 saved, can he pay cash to buy the car?
Answers: 1
Do you know the correct answer?
A school district wanted to compare ACT scores between two of its schools (school A and school B). T...
Questions in other subjects:
Mathematics, 01.12.2020 08:30

History, 01.12.2020 08:30

Health, 01.12.2020 08:30
Mathematics, 01.12.2020 08:30

Mathematics, 01.12.2020 08:30
Mathematics, 01.12.2020 08:30
History, 01.12.2020 08:30


