

Mathematics, 14.12.2020 21:10, fancycar14
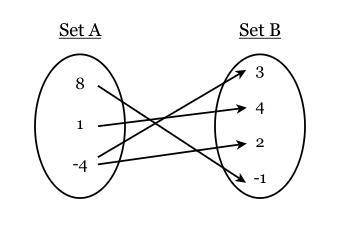
Fill in the blanks below in order to justify whether or not the mapping shown represents a function.

Answers: 1


Other questions on the subject: Mathematics
Mathematics, 21.06.2019 13:00, MIYAISSAVGE2409
Fine the area of the kite. a. 90 sq. units b. 9 sq. units c. 180 sq. units d. 45 sq. units
Answers: 1
Mathematics, 21.06.2019 18:30, mikey8510
The median of a data set is the measure of center that is found by adding the data values and dividing the total by the number of data values that is the value that occurs with the greatest frequency that is the value midway between the maximum and minimum values in the original data set that is the middle value when the original data values are arranged in order of increasing (or decreasing) magnitude
Answers: 3
Mathematics, 21.06.2019 20:00, naimareiad
Ialready asked this but i never got an answer. will give a high rating and perhaps brainliest. choose the linear inequality that describes the graph. the gray area represents the shaded region. y ≤ –4x – 2 y > –4x – 2 y ≥ –4x – 2 y < 4x – 2
Answers: 1
Do you know the correct answer?
Fill in the blanks below in order to justify whether or not the mapping shown represents a function....
Questions in other subjects:


Chemistry, 02.12.2021 21:40


Arts, 02.12.2021 21:40


