

Mathematics, 14.12.2020 17:30, gujaratif932
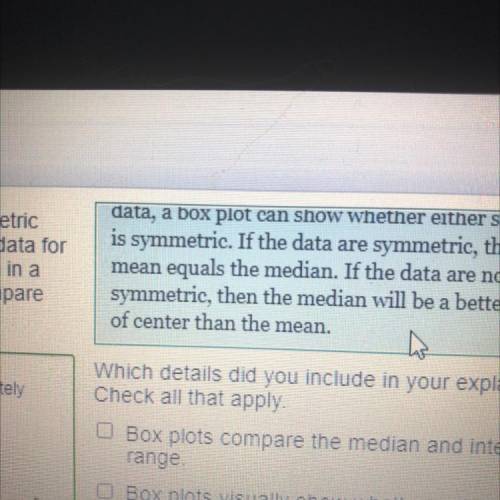
The snowball data for Resort A are close to symmetric when they are shown in a box plot. The snowfall data for Resort B are not symmetric when they are shown in a box plot. Why is a box plot a good method to compare the data? Sample response: When comparing two sets of data, a box plot can show whether either set of data is symmetric. If The data are symmetric, then the mean equals the median. If the data are not symmetric, then the median will be a better measure of center than the mean.

Answers: 2


Other questions on the subject: Mathematics
Mathematics, 21.06.2019 18:00, sydneydavis57
Jacob signs up to work for 2 1/2 hours at the school carnival. if each work shift is 3/4 hour, how many shifts will jacob work? (i just want to double check : |, for anybody that responds! : )
Answers: 3
Mathematics, 21.06.2019 21:30, gigglegirl5802
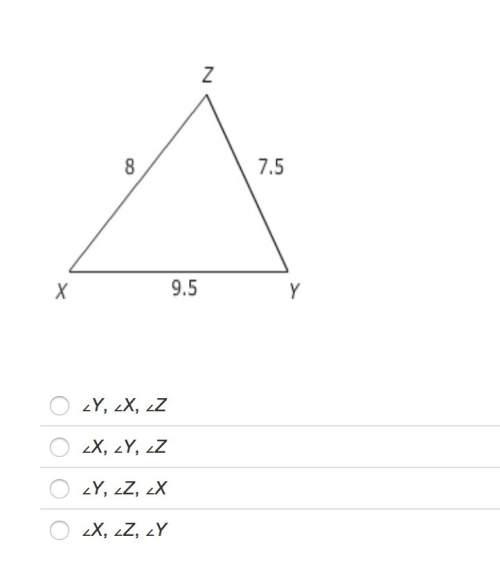
Select all the statements that apply to this figure
Answers: 2
Mathematics, 22.06.2019 00:00, Lions8457
City l has a temperature of −3 °f. city m has a temperature of −7 °f. use the number line shown to answer the questions: number line from negative 8 to positive 8 in increments of 1 is shown. part a: write an inequality to compare the temperatures of the two cities. (3 points) part b: explain what the inequality means in relation to the positions of these numbers on the number line. (4 points) part c: use the number line to explain which city is warmer. (3 points)
Answers: 2
Do you know the correct answer?
The snowball data for Resort A are close to symmetric when they are shown in a box plot. The snowfal...
Questions in other subjects:

Medicine, 11.02.2022 16:00


Mathematics, 11.02.2022 16:00


Computers and Technology, 11.02.2022 16:00

Biology, 11.02.2022 16:00
Mathematics, 11.02.2022 16:00


