

Mathematics, 14.12.2020 14:00, fatherbamboo
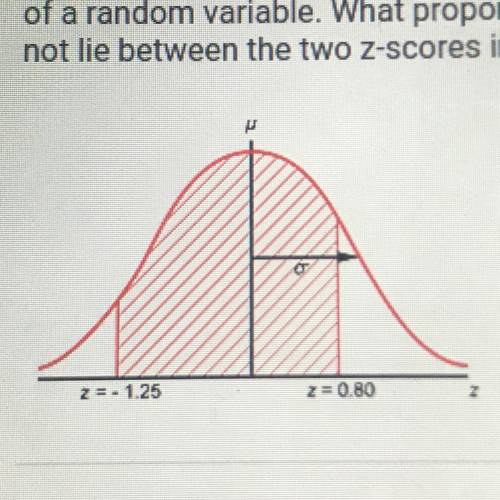
The standard normal curve shown below models the population distribution
of a random variable What proportion of the values in the population does
not ie between the two zscores indicated on the diagram?
OA 02881
OB. 0.3102
OC. 03064
OD. 0.3175
OE 0.2933

Answers: 2


Other questions on the subject: Mathematics
Mathematics, 21.06.2019 13:00, Trumpman137
If kn = 9 cm, mn = 21 cm, rs = 42 cm, and ps = 18 cm, what is the scale factor of figure klmn to figure pqrs?
Answers: 3
Mathematics, 21.06.2019 21:30, cassandramanuel
Carl's candies has determined that a candy bar measuring 3 inches long has a z-score of +1 and a candy bar measuring 3.75 inches long has a z-score of +2. what is the standard deviation of the length of candy bars produced at carl's candies?
Answers: 1
Mathematics, 21.06.2019 22:30, verdolaga2017me
Will mark determine whether the conjecture is true or false. give a counterexample for any false conjecture. given: points r, s, and t conjecture: r, s, and t are coplanar. a) false; the points do not have to be in a straight line. b) true c) false; the points to not have to form right angles. d) false; one point may not be between the other two.
Answers: 1
Do you know the correct answer?
The standard normal curve shown below models the population distribution
of a random variable What...
Questions in other subjects:
Mathematics, 21.12.2021 02:50
Mathematics, 21.12.2021 02:50

Business, 21.12.2021 02:50

English, 21.12.2021 02:50

Computers and Technology, 21.12.2021 02:50
Mathematics, 21.12.2021 02:50


