

Mathematics, 11.12.2020 01:30, alyo31500
I need help plz!! Part C
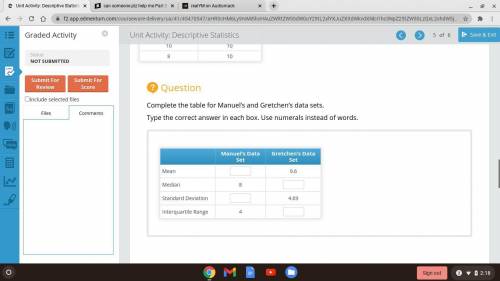
Determine the mean, median, standard deviation, and interquartile range for each data set. Then, use the graphing tool to determine the value of the standard deviation.
Number of Days Member Used Facility Last Month
Manuel’s Data Gretchen’s Data
3 22
6 4
8 7
11 8
12 12
8 15
6 10
3 7
10 9
5 6
14 13
9 3
7 8
10 10
8 10

Answers: 3


Other questions on the subject: Mathematics
Mathematics, 20.06.2019 18:04, caprisun1491
Valentino starts with a population of 1,500 amoebas that increases 35% in size every hour for a number of hours, h. the expression 1,500(1+0.35)h finds the number of amoebas after h hours. which statement about this expression is true? a. it is the initial population raised to the growth factor after h hours. b. it is the sum of the initial population and the percent increase. c. it is the sum of the initial population and the growth factor after h hours. d. it is the product of the initial population and the growth factor after h hours.
Answers: 2
Mathematics, 22.06.2019 00:30, OperatorBravo
Which equation represents h for right triangle abc
Answers: 1
Do you know the correct answer?
I need help plz!! Part C
Determine the mean, median, standard deviation, and interquartile range fo...
Questions in other subjects:


Mathematics, 15.07.2019 18:30

History, 15.07.2019 18:30

Mathematics, 15.07.2019 18:30
Biology, 15.07.2019 18:30


