

Mathematics, 10.12.2020 22:10, taytaycola223
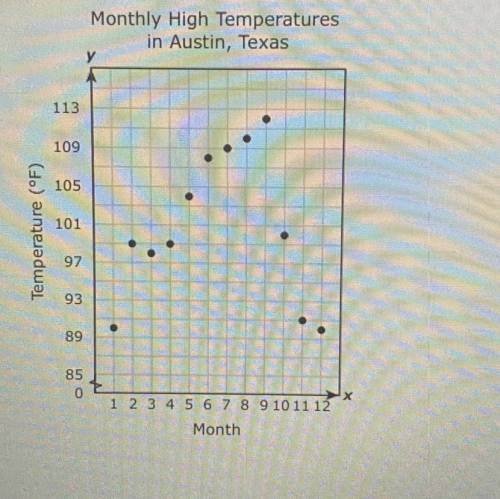
The scatterplot shows the monthly high temperature for Austin, Texas, in degrees Fahrenheit over a 12 month period
Which function best models the data from Month 1 to Month 9?
Answer
A. y = -1.62 + 111
B. y = 3.5x +85
C. y= 2.5x + 90
D. -3.32 + 130

Answers: 1


Other questions on the subject: Mathematics
Mathematics, 21.06.2019 15:00, katiebotts18
The diameter of a ball is 8 in. what is the volume of the ball? use 3.14 for pi. enter your answer as a decimal in the box. round only your final answer to the nearest hundredth.
Answers: 2
Mathematics, 21.06.2019 19:30, auzriannamarie
Tim's phone service charges $26.39 plus an additional $0.21 for each text message sent per month. if tim's phone bill was $31.64, which equation could be used to find how many text messages, x, tim sent last month?
Answers: 1
Do you know the correct answer?
The scatterplot shows the monthly high temperature for Austin, Texas, in degrees Fahrenheit over a 1...
Questions in other subjects:
Mathematics, 30.10.2019 04:31

History, 30.10.2019 04:31
Mathematics, 30.10.2019 04:31

Biology, 30.10.2019 04:31

English, 30.10.2019 04:31
Mathematics, 30.10.2019 04:31
Biology, 30.10.2019 04:31


