


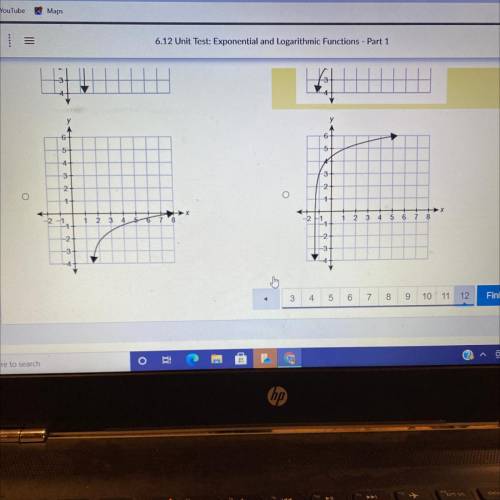
Which graph represents the logarithmic function?
y=In (3x + 4)+3
...

Mathematics, 10.12.2020 18:30, sarinaneedshelp01
Which graph represents the logarithmic function?
y=In (3x + 4)+3

Answers: 3
Other questions on the subject: Mathematics
Mathematics, 21.06.2019 13:30, Bassoonist
Volume of cylinder with a radius of 8cm and height of 25 cm
Answers: 1
Mathematics, 21.06.2019 16:30, marbuscis99
Prove that the sum of two consecutive exponents of the number 5 is divisible by 30.if two consecutive exponents are 5n and 5n + 1, then their sum can be written as 30.
Answers: 1
Mathematics, 22.06.2019 01:30, kadinmorgan
Acell phone company offers two plans to its subscribers. at the time new subscribers sign up, they are asked to provide some demographic information. the mean yearly income for a sample of 40 subscribers to plan a is $45,000 with a standard deviation of $9,200. for a sample of 25 subscribers to plan b, the mean income is $64,300 with a standard deviation of $7,100. at the 0.025 significance level, is it reasonable to conclude the mean income of those selecting plan b is larger? assume unequal population standard deviations. hint: for the calculations, assume the plan a as the first sample. what is the decision rule? (negative amount should be indicated by a minus sign. round your answer to 3 decimal places.) compute the value of the test statistic. (negative amount should be indicated by a minus sign. round your answer to 2 decimal places.) what is your decision regarding h0 ? reject h0 fail to reject h0 compute the p-value. less than 0.01 between 0.01 and 0.025 between 0.025 and 0.05 between 0.05 and 0.10 greater than 0.10
Answers: 3
Do you know the correct answer?
Questions in other subjects:


Social Studies, 30.07.2020 22:01

Engineering, 30.07.2020 22:01
Mathematics, 30.07.2020 22:01

English, 30.07.2020 22:01


Biology, 30.07.2020 22:01


