


What is the interquartile range (1QR) of the data set represented by this box
plot?
38
...

Mathematics, 10.12.2020 18:10, allicat8735
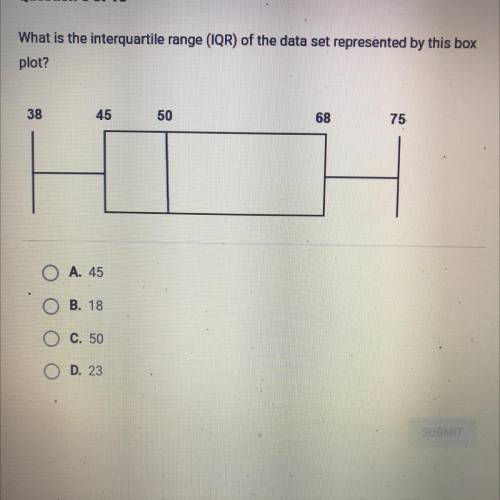
What is the interquartile range (1QR) of the data set represented by this box
plot?
38
45
50
68
75
O A. 45
O B. 18
O C. 50
O D. 23

Answers: 3
Other questions on the subject: Mathematics
Mathematics, 21.06.2019 15:40, kevenluna10oytivm
What is the first quartile of the data set? 10, 11, 12, 15, 17, 19, 22, 24, 29, 33, 38 a. 12 b. 19 c. 29 d. 10
Answers: 1
Mathematics, 21.06.2019 19:20, hahah265
Suppose that a households monthly water bill (in dollars) is a linear function of the amount of water the household uses (in hundreds of cubic feet, hcf). when graphed, the function gives a line with slope of 1.65. if the monthly cost for 13 hcf is $46.10 what is the monthly cost for 19 hcf?
Answers: 3
Mathematics, 21.06.2019 23:30, michaellangley
Consider the input and output values for f(x) = 2x - 3 and g(x) = 2x + 7. what is a reasonable explanation for different rules with different input values producing the same sequence?
Answers: 1
Do you know the correct answer?
Questions in other subjects:

Social Studies, 04.11.2020 19:40


History, 04.11.2020 19:40
English, 04.11.2020 19:40


