

Mathematics, 04.02.2020 19:49, doggielover36
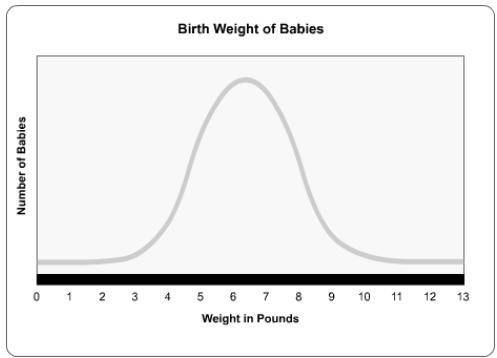
This graph shows the variation in birth weights in a specific population of humans. use the graph data to answer the question.
which statement describes the variation of birth weights in this population?
a.) there is no variation in birth weight.
b.) there is a moderate variation in birth weight.
c.) variation changes over time.

Answers: 3


Other questions on the subject: Mathematics
Mathematics, 21.06.2019 20:30, dbzafgtkiap9wyrl
The number of 8th graders who responded to a poll of 6th grade and 8 th graders was one fourtg of the number of 6th graders whi responded if a total of 100 students responddd to the poll how many of the students responded were 6 th graders
Answers: 1
Mathematics, 21.06.2019 21:20, thakidd4567
Find the missing variable for a parallelogram: a = latex: 28in^2 28 i n 2 h = b = 6.3 in (1in=2.54cm)
Answers: 3
Mathematics, 22.06.2019 08:00, alyssa2157
Write a function in terms of t that represents the situation. a company profit of $20,000 decreases by 13.4% each year
Answers: 1
Do you know the correct answer?
This graph shows the variation in birth weights in a specific population of humans. use the graph da...
Questions in other subjects:

Mathematics, 17.02.2022 05:20


Social Studies, 17.02.2022 05:30

Mathematics, 17.02.2022 05:30


