Mathematics, 10.12.2020 18:00, abby894927
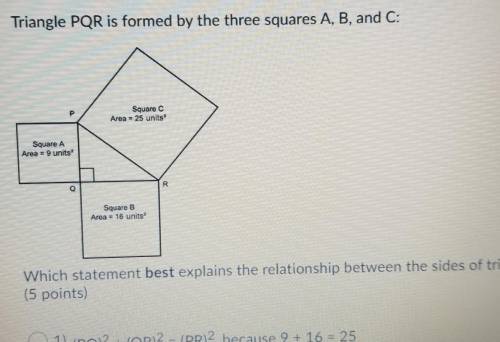
Guys i might fail this semester and get in big trouble help me please


Answers: 3
Other questions on the subject: Mathematics

Mathematics, 21.06.2019 19:00, mustafajibawi1
Eis the midpoint of line segment ac and bd also line segment ed is congruent to ec prove that line segment ae is congruent to line segment be
Answers: 3

Mathematics, 21.06.2019 23:00, Lizethh1
Acaterer knows he will need 60, 50, 80, 40 and 50 dinner napkins on five successive evenings. he can purchase new napkins initially at 25 cents each, after which he can have dirty napkins laundered by a fast one-day laundry service (i. e., dirty napkins given at the end of the day will be ready for use the following day) at 15 cents each, or by a slow two-day service at 8 cents each or both. the caterer wants to know how many napkins he should purchase initially and how many dirty napkins should be laundered by fast and slow service on each of the days in order to minimize his total costs. formulate the caterer’s problem as a linear program as follows (you must state any assumptions you make): a. define all variables clearly. how many are there? b. write out the constraints that must be satisfied, briefly explaining each. (do not simplify.) write out the objective function to be minimized. (do not simplify.)
Answers: 1

Mathematics, 22.06.2019 00:30, angelyce4142
How can you check that you have correctly converted frequencies to relative frequencies?
Answers: 1

Mathematics, 22.06.2019 02:00, mathhelppls14
1. the manager of collins import autos believes the number of cars sold in a day (q) depends on two factors: (1) the number of hours the dealership is open (h) and (2) the number of salespersons working that day (s). after collecting data for two months (53 days), the manager estimates the following log-linear model: q 4 equation 1 a. explain, how to transform the log-linear model into linear form that can be estimated using multiple regression analysis. the computer output for the multiple regression analysis is shown below: q4 table b. how do you interpret coefficients b and c? if the dealership increases the number of salespersons by 20%, what will be the percentage increase in daily sales? c. test the overall model for statistical significance at the 5% significance level. d. what percent of the total variation in daily auto sales is explained by this equation? what could you suggest to increase this percentage? e. test the intercept for statistical significance at the 5% level of significance. if h and s both equal 0, are sales expected to be 0? explain why or why not? f. test the estimated coefficient b for statistical significance. if the dealership decreases its hours of operation by 10%, what is the expected impact on daily sales?
Answers: 2
Do you know the correct answer?
Guys i might fail this semester and get in big trouble help me please
...
...
Questions in other subjects:

Health, 24.09.2019 23:30

Biology, 24.09.2019 23:30


Mathematics, 24.09.2019 23:30


Social Studies, 24.09.2019 23:30


Biology, 24.09.2019 23:30

English, 24.09.2019 23:30


