

Mathematics, 10.12.2020 17:20, krystalhurst97
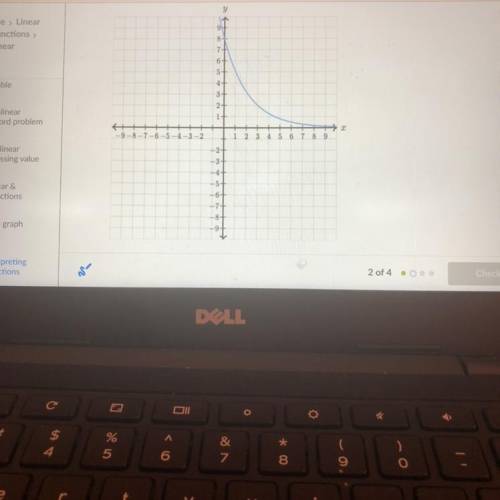
The illustration below shows the graph of y as a function of z.
Complete the following sentences based on the graph of the function.
. As increases, y
• The rate of change for y as a function of z is
• For all values of , the function value y
. The y-intercept of the graph is the function value y =
, therefore the function is
0
. When z= 1, the function value y

Answers: 2


Other questions on the subject: Mathematics
Mathematics, 21.06.2019 17:30, nurmukhammada
Can someone me with this problem i don't understand i need
Answers: 2
Mathematics, 21.06.2019 19:30, gyliahicks
Jada has a meal in a restaurant she adds up the prices listed on the menu for everything they ordered and gets a subtotal of $42.00. after tax the total is 45.99. what percentage of the subtotal is the total?
Answers: 2
Mathematics, 22.06.2019 00:00, andreaolvera
Add, subtract, multiply, or divide as indicated. list any restrictions for the variable(s) and simplify the answers when possible. 1) x-2 / x+5 + 3x / 2x-1 2) x+6 / x-6 - x^2 / x+6 3) x+9 / x-4 + x+2 / x^2-11x+28 4) x / x^2-64 + 11 / 2x^2+11x-40 5) 5 / x + 11 / x-3 - x-4 / x^2+2x-15
Answers: 1
Mathematics, 22.06.2019 06:00, jojo492192
Mr. chen is parking in a lot downtown. the graph shows the relationship between the time and the total cost of parking. evaluate the function for and input of 10.
Answers: 2
Do you know the correct answer?
The illustration below shows the graph of y as a function of z.
Complete the following sentences ba...
Questions in other subjects:

Computers and Technology, 07.05.2021 22:00
Computers and Technology, 07.05.2021 22:00

Mathematics, 07.05.2021 22:00
Mathematics, 07.05.2021 22:00

Chemistry, 07.05.2021 22:00


