


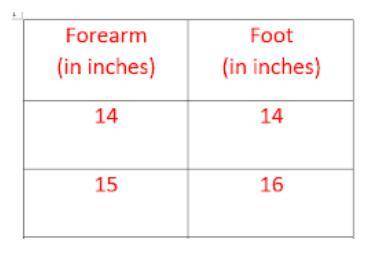
8. Find the rate of change for the set of data provided in the image below. *
2 points
...

Mathematics, 10.12.2020 02:20, carma43
8. Find the rate of change for the set of data provided in the image below. *
2 points
2/3
3/2
3
2

Answers: 1
Other questions on the subject: Mathematics
Mathematics, 21.06.2019 16:30, safiyabrowne7286
How do you summarize data in a two-way frequency table?
Answers: 3
Mathematics, 21.06.2019 19:00, jamilamiller200
Solve 3x-18=2y and 5x-6y=6 by elimination show work
Answers: 2
Mathematics, 21.06.2019 21:00, kyllow5644
Ftara spends $219 a month for her car payment and she makes $3,200 a month, what percent of her monthly income is spent on her car payment?
Answers: 2
Mathematics, 22.06.2019 00:20, sagetpc68741
If your score on your next statistics test is converted to a z score, which of these z scores would you prefer: minus2.00, minus1.00, 0, 1.00, 2.00? why? a. the z score of 2.00 is most preferable because it is 2.00 standard deviations above the mean and would correspond to the highest of the five different possible test scores. b. the z score of 0 is most preferable because it corresponds to a test score equal to the mean. c. the z score of minus2.00 is most preferable because it is 2.00 standard deviations below the mean and would correspond to the highest of the five different possible test scores. d. the z score of minus1.00 is most preferable because it is 1.00 standard deviation below the mean and would correspond to an above average
Answers: 2
Do you know the correct answer?
Questions in other subjects:

English, 25.09.2019 19:30
English, 25.09.2019 19:30

Chemistry, 25.09.2019 19:40

Chemistry, 25.09.2019 19:40

History, 25.09.2019 19:40


