

Mathematics, 09.12.2020 22:10, apascascio2316
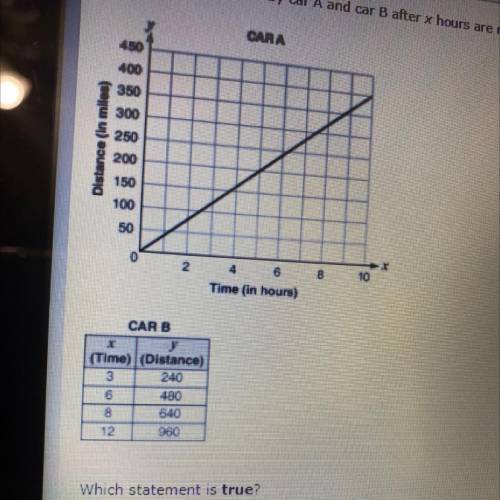
The distances traveled by car A and car B after x hours are represented by the graph and table below. Which statement is true?
answers: the speed of car a is twice the speed of car b
the speed of car b is twice the speed of car a
the speed of car a is 2.4 time the speed of car h
the speed of car b is 2.4 times the speed of car a

Answers: 1


Other questions on the subject: Mathematics
Mathematics, 21.06.2019 20:30, yfgkeyonna
On a cm grid, point p has coordinates (3,-1) and point q has coordinates (-5,6) calculate the shortest distance between p and q give your answer to 1 decimal place
Answers: 2
Mathematics, 21.06.2019 23:20, cynayapartlow88
Which best describes a central bank's primary goals? limiting inflation and reducing unemployment reducing unemployment and maintaining cash flow controlling stagflation and reducing unemployment managing credit and ensuring the money supply's liquidity
Answers: 1
Do you know the correct answer?
The distances traveled by car A and car B after x hours are represented by the graph and table below...
Questions in other subjects:


Computers and Technology, 25.06.2019 08:00
Mathematics, 25.06.2019 08:00
Computers and Technology, 25.06.2019 08:00
Mathematics, 25.06.2019 08:00


