


Figure ABCD is transformed to figure A'B'C'D':
5
4
ДВ
3
2
TC
1<...

Mathematics, 09.12.2020 22:00, diamondalize21p84czi
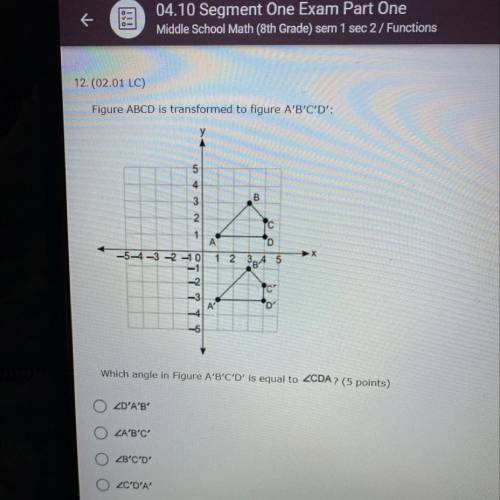
Figure ABCD is transformed to figure A'B'C'D':
5
4
ДВ
3
2
TC
1
А
D
-3 -2 -10
1 2 3 4 5
-2
TC
-3
A
D
Which angle in Figure A'B'C'D' is equal to ZCDA? (5 points)
ZD'A'B'
ZA'B'C'
ZB'C'D'
ZC'D'A'

Answers: 1
Other questions on the subject: Mathematics
Mathematics, 22.06.2019 00:30, wbrandi118
On ryan's last social studies test there were two types of questions true/false worth 3 points each and multiple choice questions worth 4 points each
Answers: 3
Mathematics, 22.06.2019 01:30, Jharsh2300
Urgent need asap △abc is similar to △xyz. also, side ab measures 6 cm, side bc measures 18 cm, and side xy measures 12 cm. what is the measure of side yz ? enter your answer in the box.
Answers: 1
Mathematics, 22.06.2019 02:00, mathhelppls14
1. the manager of collins import autos believes the number of cars sold in a day (q) depends on two factors: (1) the number of hours the dealership is open (h) and (2) the number of salespersons working that day (s). after collecting data for two months (53 days), the manager estimates the following log-linear model: q 4 equation 1 a. explain, how to transform the log-linear model into linear form that can be estimated using multiple regression analysis. the computer output for the multiple regression analysis is shown below: q4 table b. how do you interpret coefficients b and c? if the dealership increases the number of salespersons by 20%, what will be the percentage increase in daily sales? c. test the overall model for statistical significance at the 5% significance level. d. what percent of the total variation in daily auto sales is explained by this equation? what could you suggest to increase this percentage? e. test the intercept for statistical significance at the 5% level of significance. if h and s both equal 0, are sales expected to be 0? explain why or why not? f. test the estimated coefficient b for statistical significance. if the dealership decreases its hours of operation by 10%, what is the expected impact on daily sales?
Answers: 2
Do you know the correct answer?
Questions in other subjects:


Spanish, 08.12.2020 01:10
Mathematics, 08.12.2020 01:10

Computers and Technology, 08.12.2020 01:10


Chemistry, 08.12.2020 01:10


