


Select the correct answer,
different
The graph shows the population of black toads in a fores...

Mathematics, 08.12.2020 06:00, mauricestepenson791
Select the correct answer,
different
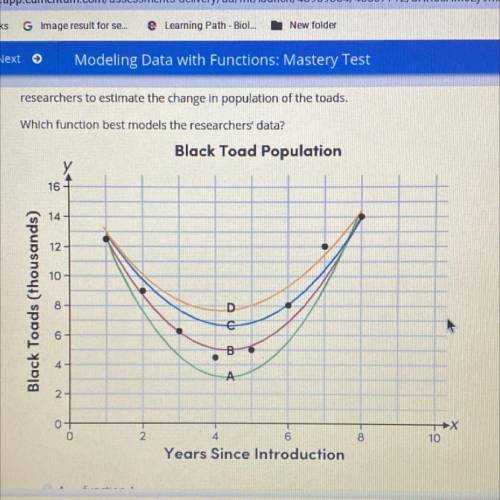
The graph shows the population of black toads in a forest reserve since their introduction. It also includes functions drawn
researchers to estimate the change in population of the toads.
Which function best models the researchers' data?
A. function A
B. function B
C. function C
D. function D

Answers: 2
Other questions on the subject: Mathematics
Mathematics, 21.06.2019 16:10, michaelwthms
To describe a sequence of transformations that maps triangle abc onto triangle a"b"c", a student starts with a reflection over the x-axis. how should the student complete the sequence of transformations to map triangle abc onto triangle a"b"c"? plz
Answers: 1
Mathematics, 21.06.2019 17:30, nurmukhammada
Can someone me with this problem i don't understand i need
Answers: 2
Mathematics, 21.06.2019 19:30, MagicDragon4734
Which of the points a(6, 2), b(0, 0), c(3, 2), d(−12, 8), e(−12, −8) belong to the graph of direct variation y= 2/3 x?
Answers: 2
Do you know the correct answer?
Questions in other subjects:


Physics, 08.10.2019 00:00


Mathematics, 08.10.2019 00:00


