

Mathematics, 08.12.2020 02:30, taylortayshaun7
Which graph represents the solution set of the system of inequalities?
{3y≥x−93x+y>−3
please only comment if you dont know, its kinda annoying how much people just use an actaul answer slot to put the fact they dont know, it will be reported
A system of 2 linear inequalities graphed on a coordinate plane. The horizontal x axis ranges from negative 5 to 5 in increments of 1. The vertical y axis ranges from negative 5 to 5 in increments of 1. A dashed line passes through begin ordered pair 0 comma negative 3 end ordered pair and begin ordered pair negative 2 comma 3 end ordered pair. A solid line passes through begin ordered pair 0 comma negative 3 end ordered pair and begin ordered pair negative 3 comma negative 4 end ordered pair. The region above the dashed line and above the solid line is shaded.
A system of 2 linear inequalities graphed on a coordinate plane. The horizontal x axis ranges from negative 5 to 5 in increments of 1. The vertical y axis ranges from negative 5 to 5 in increments of 1. A dashed line passes through begin ordered pair 0 comma negative 3 end ordered pair and begin ordered pair negative 3 comma negative 2 end ordered pair. A solid line passes through begin ordered pair 0 comma negative 3 end ordered pair and begin ordered pair 2 comma 3 end ordered pair. The region above the dashed line and below the solid line is shaded.
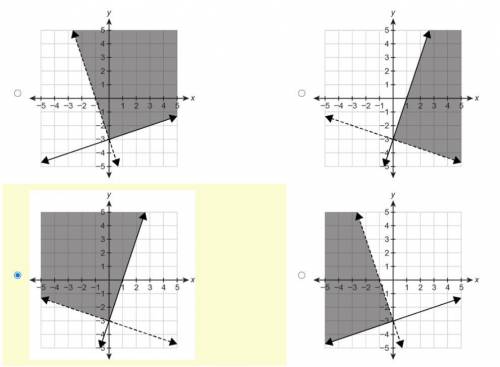
A system of 2 linear inequalities graphed on a coordinate plane. The horizontal x axis ranges from negative 5 to 5 in increments of 1. The vertical y axis ranges from negative 5 to 5 in increments of 1. A dashed line passes through begin ordered pair 0 comma negative 3 end ordered pair and begin ordered pair 3 comma negative 4 end ordered pair. A solid line passes through begin ordered pair 0 comma negative 3 end ordered pair and begin ordered pair 2 comma 3 end ordered pair. The region above the dashed line and above the solid line is shaded.
A system of 2 linear inequalities graphed on a coordinate plane. The horizontal x axis ranges from negative 5 to 5 in increments of 1. The vertical y axis ranges from negative 5 to 5 in increments of 1. A dashed line passes through begin ordered pair 0 comma negative 3 end ordered pair and begin ordered pair negative 2 comma 3 end ordered pair. A solid line passes through begin ordered pair 0 comma negative 3 end ordered pair and begin ordered pair 3 comma negative 2 end ordered pair. The region below the dashed line and above the solid line is shaded.

Answers: 3


Other questions on the subject: Mathematics
Mathematics, 22.06.2019 03:30, macylen3900
Arock was dropped from the top of a building. the function that describes the height after it was dropped is f(x)=64-16x^2. what are the zeros of the function and what do they mean?
Answers: 1
Mathematics, 22.06.2019 04:20, quintonps12
Which math statement does not contain a math variable ?
Answers: 1
Mathematics, 22.06.2019 05:00, imalivingpotato
There are 1872 steps in a building that has 104 floors. each floor has the same number of steps. a second building has the same number of floors but 2 fewer steps between each floor. how many steps are there between each floor of the second building?
Answers: 3
Do you know the correct answer?
Which graph represents the solution set of the system of inequalities?
{3y≥x−93x+y>−3
Questions in other subjects:

History, 17.04.2020 06:07


Chemistry, 17.04.2020 06:07

Mathematics, 17.04.2020 06:07
Mathematics, 17.04.2020 06:07
Mathematics, 17.04.2020 06:07


