

Mathematics, 07.12.2020 18:10, hugoreyes16jr
(09.01 MC)
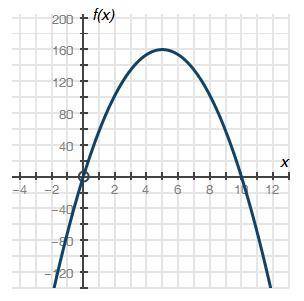
The graph below shows a company's profit f(x), in dollars, depending on the price of pencils x, in dollars, being sold by the company:
graph of quadratic function f of x having x intercepts at ordered pairs negative 0, 0 and 10, 0. The vertex is at 5, 160
Part A: What do the x-intercepts and maximum value of the graph represent? What are the intervals where the function is increasing and decreasing, and what do they represent about the sale and profit? (6 points)
Part B: What is an approximate average rate of change of the graph from x = 2 to x = 5, and what does this rate represent? (4 points)
(10 points)

Answers: 3


Other questions on the subject: Mathematics
Mathematics, 21.06.2019 18:00, Mrlittlefish
What is the location of point g, which partitions the directed line segment from d to f into a 5: 4 ratio? –1 0 2 3
Answers: 1
Mathematics, 21.06.2019 22:00, alondrachon
Asales representative from a local radio station is trying to convince the owner of a small fitness club to advertise on her station. the representative says that if the owner begins advertising on the station today, the club's total number of members will grow exponentially each month. she uses the given expression to model the number of club members, in hundreds, after advertising for t months.
Answers: 2
Do you know the correct answer?
(09.01 MC)
The graph below shows a company's profit f(x), in dollars, depending on the price of pen...
Questions in other subjects:
Mathematics, 04.02.2020 13:57


Mathematics, 04.02.2020 13:57
History, 04.02.2020 13:57
Biology, 04.02.2020 13:57


