


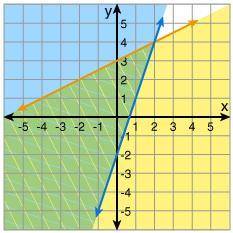
The graph shows the solution for which inequalities?
y ≥ x + 2 and y ≤ 2x + 3
y ≥ x - 2 and y...

Mathematics, 06.12.2020 05:40, whitbol
The graph shows the solution for which inequalities?
y ≥ x + 2 and y ≤ 2x + 3
y ≥ x - 2 and y ≤ 2x - 3
y ≥ 3x - 2 and y ≤ x + 3
y ≤ 3x - 2 and y ≥ x + 3

Answers: 2
Other questions on the subject: Mathematics
Mathematics, 21.06.2019 21:00, batmanmarie2004
The functions below show the amount of money bella and sweet t had saved after earning money for doing chores. which description best compares the two functions?
Answers: 1
Do you know the correct answer?
Questions in other subjects:

History, 25.01.2022 01:30
Mathematics, 25.01.2022 01:30

Computers and Technology, 25.01.2022 01:30
Mathematics, 25.01.2022 01:30

Mathematics, 25.01.2022 01:30


