


PLEASE HELP ASAP IM IN THE EXAM RIGHT NOW
(THE GRAPH IS LINKED)
The graph below shows a compa...

Mathematics, 05.12.2020 04:10, markyyy53
PLEASE HELP ASAP IM IN THE EXAM RIGHT NOW
(THE GRAPH IS LINKED)
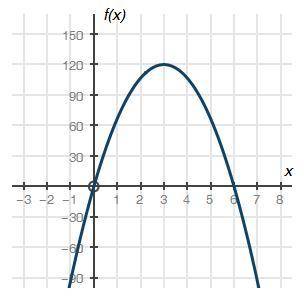
The graph below shows a company's profit f(x), in dollars, depending on the price of pens x, in dollars, sold by the company:
Graph of quadratic function f of x having x intercepts at ordered pairs 0, 0 and 6, 0. The vertex is at 3, 120.
Part A: What do the x-intercepts and maximum value of the graph represent? What are the intervals where the function is increasing and decreasing, and what do they represent about the sale and profit? (4 points)
Part B: What is an approximate average rate of change of the graph from x = 3 to x = 5, and what does this rate represent? (3 points)
Part C: Describe the constraints of the domain. (3 points)

Answers: 2
Other questions on the subject: Mathematics
Mathematics, 21.06.2019 23:00, noahdwilke
36x2 + 49y2 = 1,764 the foci are located at: (-√13, 0) and (√13,0) (0, -√13) and (0,√13) (-1, 0) and (1, 0)edit: the answer is (- the square root of 13, 0) and (the square root of 13, 0)
Answers: 1
Mathematics, 21.06.2019 23:30, xxaurorabluexx
Pleting the square f the given find the x-intercepts of the parabola with vertex (-5,13) and y-intercept (0, 12). write your answer in this form: (14,.99). if necessary, round to the nearest hundredth. *- h enter the correct answer, de verter, and ametry 00000 done doo
Answers: 2
Do you know the correct answer?
Questions in other subjects:


Mathematics, 14.03.2020 22:37

Mathematics, 14.03.2020 22:37
Mathematics, 14.03.2020 22:37
Mathematics, 14.03.2020 22:38


