

Mathematics, 03.12.2020 23:00, den14
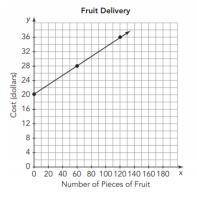
Determine whether the graph represents a proportional or non-proportional relationship. Then select the correct equation in the form y=mx or y=mx+b to represent the relationship between the independent and dependent quantities.
This graph is an example of a blank area relationship. The equation that represents the relationship between the independent and dependent quantities is blank area.
Proportional
Unproportional
y=5x+20
y=60x
y=x+30
Help me fill in the blanks plz

Answers: 2


Other questions on the subject: Mathematics
Mathematics, 21.06.2019 15:30, lberman2005p77lfi
Answer question above and explain each step : )
Answers: 3
Mathematics, 21.06.2019 18:30, joaquin42
Which of the statements about the graph of the function y = 2x are true? check all of the boxes that apply. the domain is all real numbers x because the exponent of 2 can be any real number when the x-values increases by 1 unit, the y-value multiplies by 2. the y-intercept is (0, 1). the graph never goes below the x-axis because powers of 2 are never negative. the range is all real numbers.
Answers: 1
Mathematics, 21.06.2019 21:40, lineaeriksen
Ineed your ! i was to turn this into pond first thing i gotta do is outline the inside with this plastic how big should i cut the plastic the height: 10 1/2” the length: 40” the width: 12” me !
Answers: 1
Do you know the correct answer?
Determine whether the graph represents a proportional or non-proportional relationship. Then select...
Questions in other subjects:

Spanish, 17.02.2022 14:00

Mathematics, 17.02.2022 14:00


Physics, 17.02.2022 14:00
Mathematics, 17.02.2022 14:00

German, 17.02.2022 14:00


