

Mathematics, 03.12.2020 22:20, gabev420
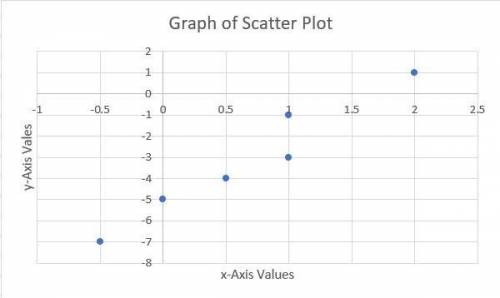
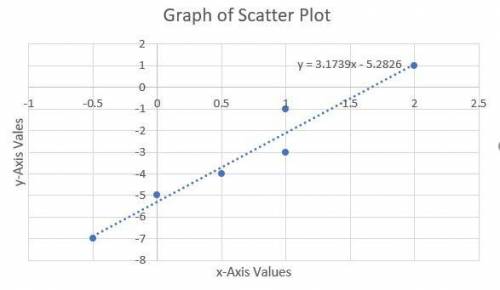
Which equation best models the data shown in the scatter plot?
In the graph of scatter plot, the range of the x axis is minus four to four by increment of one and the range of the y axis is minus seven to one by increment of one. On the x axis minus four, minus two, two, and four are labeled. On the y axis minus six, minus four, and minus two are labeled. On the graph, there are points at (-0.5, -7), (0, -5), (0.5, -4), (1, -3), (1, -1), and (2, 1).
A. y = x − 3
B. y = x − 5
C. y = 3x − 3
D. y = 3x − 5

Answers: 1


Other questions on the subject: Mathematics
Mathematics, 21.06.2019 17:30, sarinawhitaker
25 ! the line of best fit is h = 5a + 86. predict the height at age 16. show your work.
Answers: 1
Mathematics, 21.06.2019 18:00, tasnimsas3
Plz a. s. a. p. the table shows the number of male and female contestants who did not win a prize. what is the probability that a randomly selected contestant won a prize, given that the contestant was female? write the probability as a percent. round to the neares tenth, if needed.
Answers: 1
Mathematics, 21.06.2019 18:00, mihirkantighosh
Arecipe calls for 32 fluid ounces of heavy cream. how many 1 pint containers of heavy cream are needed to make the recipe?
Answers: 2
Do you know the correct answer?
Which equation best models the data shown in the scatter plot?
In the graph of scatter plot, the ra...
Questions in other subjects:

Social Studies, 06.07.2021 17:10
Mathematics, 06.07.2021 17:10

English, 06.07.2021 17:10


Mathematics, 06.07.2021 17:20
Mathematics, 06.07.2021 17:20
Mathematics, 06.07.2021 17:20


