

Mathematics, 03.12.2020 20:20, perezsamantha3oqr0za
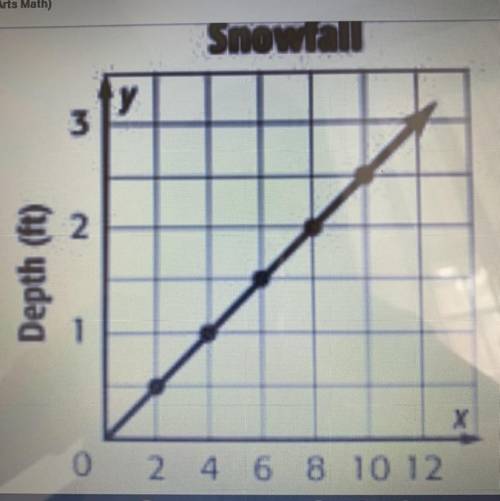
1- Use the graph at the right. It shows the depth in feet of snow after each two-hour period during
a snowstorm.*
2- does the graph show a constant rate of change? Explain
3- if the graph is extended to the right, could you expect the slope to remain constant? Explain
Plisss help me

Answers: 1


Other questions on the subject: Mathematics
Mathematics, 21.06.2019 23:00, firefightergros7271
Match the vocabulary to the proper definition. in probability, two events in which 1. conditional probability the outcome of one event is independent of the outcome of a second event. 2. dependent events in probability, two events in which the outcome of one event is dependent on the outcome of a second event. the probability of an event in which the outcome of the event is conditional on the outcome of one or more different events. 3. independent events
Answers: 2
Mathematics, 22.06.2019 00:00, valenciadewalt25
As a salesperson you get $50/day and $3.60/each sales you make. if you want to make $60 in one day, how many sales would you need need to make ? a 3b 4c 5d 6 show work.
Answers: 1
Do you know the correct answer?
1- Use the graph at the right. It shows the depth in feet of snow after each two-hour period during...
Questions in other subjects:


