


On Saturday, the Anderson
Family had dinner at a
restaurant. They ordered 2
pizzas and...

Mathematics, 03.12.2020 19:20, lailabirdiemae
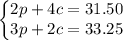
On Saturday, the Anderson
Family had dinner at a
restaurant. They ordered 2
pizzas and 4 cheeseburgers for
$31.50. The following weekend,
the Anderson Family had dinner
at the same restaurant where
they ordered 3 pizzas and 2
cheeseburgers for $33.25. Which
system of equations can be used
to determine the cost of one
pizza (p) and one cheeseburger
(c)?

Answers: 1
Other questions on the subject: Mathematics
Mathematics, 21.06.2019 19:00, eparikh7317
Rob spent 25%, percent more time on his research project than he had planned. he spent an extra h hours on the project. which of the following expressions could represent the number of hours rob actually spent on the project? two answers
Answers: 1
Mathematics, 21.06.2019 20:50, elha20
Samson is going shopping for sugar and butter to make three different kinds of cookies: lemon bars, peanut butter cookies, and sugar cookies. the recipe for lemon bars calls for 2 cups of flour, 2 cups of sugar, and 1 stick of butter. the peanut butter cookie recipe calls for 2 cups of flour, 4 cup of sugar and 2 stick of butter. the sugar cookie recipe calls for 1 cup of flour, 2 cups of sugar, and 2 sticks of butter. sampson has 13 cups of flour at home, and he buys 12 cups (6 pounds) of sugar and 10 sticks of butter. how many batches of each type of cookie can he make? samson can make batches of lemon bars, batches of peanut butter cookies, and batches of 09 cookies submit reset
Answers: 1
Mathematics, 21.06.2019 21:00, lunnar2003
Graph the system of inequalities presented here on your own paper, then use your graph to answer the following questions: y < 4x − 8 y is greater than or equal to negative 5 over 2 times x plus 5 part a: describe the graph of the system, including shading and the types of lines graphed. provide a description of the solution area. (6 points) part b: is the point (5, −8) included in the solution area for the system? justify your answer mathematically. (4 points)
Answers: 3
Mathematics, 21.06.2019 23:40, preciosakassidy
The frequency table shows the results of a survey asking people how many hours they spend online per week. on a piece of paper, draw a histogram to represent the data. then determine which answer choice matches the histogram you drew. in order here is the.. hours online: 0-3, 4-7, 8-11, 12-15, and 16-19. frequency: 5, 8, 10, 8, 7 answer for the question is in the picture! : )
Answers: 2
Do you know the correct answer?
Questions in other subjects:


Business, 11.10.2019 16:30
History, 11.10.2019 16:30
Business, 11.10.2019 16:30
History, 11.10.2019 16:30

Geography, 11.10.2019 16:30

Biology, 11.10.2019 16:30


