

Mathematics, 03.12.2020 18:40, ortegamagellynt
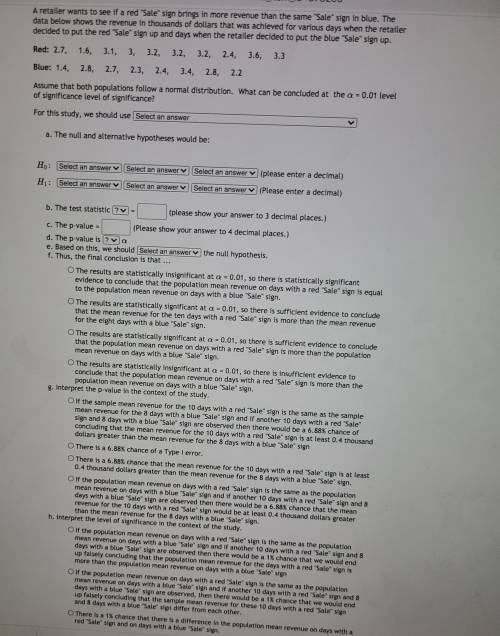
A retailer wants to see if a red "Sqle" sign brings in more revenue than the same "Sale" sign in blue. The data below shows the revenue in thousands of dollars that was achieved for the various days when the retailer decides to put the red "Sale" sign up and days when the retailer decided to put the blue "Sale" sign up.
Red 2.7, 1.6, 3.1, 3, 3.2, 3.2, 3.2, 2.4, 3.6, 3.3
Blue 1.4, 2.8, 2.7, 2.3, 2.4, 3.4, 2.8, 2.2
Assume that both populations follow q normal distribution. What can be concluded at the a = 0.01 level of significance?
For this study, we should use?
H0:
H1:

Answers: 1


Other questions on the subject: Mathematics
Mathematics, 22.06.2019 00:00, jadfavors4321
Parallelogram efgh is a rectangle. he = 6, and fe = 8. find ge: and find fj:
Answers: 1
Mathematics, 22.06.2019 00:30, janeou17xn
What is the sum of the geometric series in which a1 = 7, r = 3, and an = 1,701? hint: cap s sub n equals start fraction a sub one left parenthesis one minus r to the power of n end power right parenthesis over one minus r end fraction comma r ≠ 1, where a1 is the first term and r is the common ratio
Answers: 1
Do you know the correct answer?
A retailer wants to see if a red "Sqle" sign brings in more revenue than the same "Sale" sign in blu...
Questions in other subjects:


Health, 17.12.2020 19:40
History, 17.12.2020 19:40
History, 17.12.2020 19:40

Geography, 17.12.2020 19:40
English, 17.12.2020 19:40


