


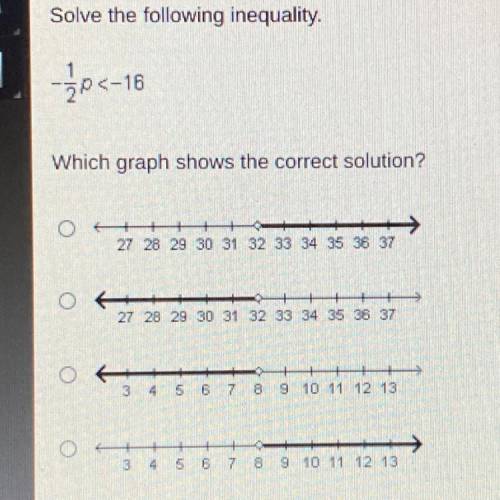
Solve the following inequality.
Jo<-16
Which graph shows the correct solution
...

Mathematics, 03.12.2020 03:00, cannonkd
Solve the following inequality.
Jo<-16
Which graph shows the correct solution

Answers: 2
Other questions on the subject: Mathematics
Mathematics, 22.06.2019 01:30, marianasanin2007
Two numbers have a sum of 93. if one number is p, express the other number in terms of p.
Answers: 1
Mathematics, 22.06.2019 02:30, Leii691
According to a research study, parents with young children slept 6.4 hours each night last year, on average. a random sample of 18 parents with young children was surveyed and the mean amount of time per night each parent slept was 6.8. this data has a sample standard deviation of 0.9. (assume that the scores are normally distributed.) researchers conduct a one-mean hypothesis at the 5% significance level, to test if the mean amount of time parents with young children sleep per night is greater than the mean amount of time last year. the null and alternative hypotheses are h0: μ=6.4 and ha: μ> 6.4, which is a right-tailed test. the test statistic is determined to be t0=1.89 using the partial t-table below, determine the critical value(s). if there is only one critical value, leave the second answer box blank.
Answers: 3
Mathematics, 22.06.2019 03:30, texas101st78
Find the solution set for this equation: t^2+7t=0 separate the two values with a comma.
Answers: 2
Do you know the correct answer?
Questions in other subjects:

Chemistry, 04.05.2021 05:50


Mathematics, 04.05.2021 05:50

Social Studies, 04.05.2021 05:50
Mathematics, 04.05.2021 05:50


