

Mathematics, 02.12.2020 22:20, zurfluhe
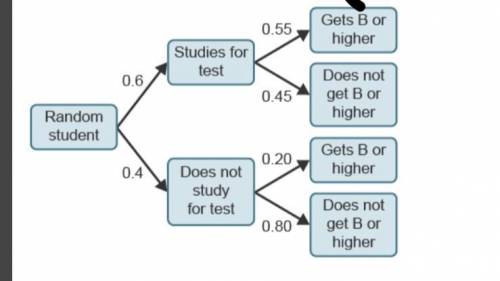
At the beginning of the semester, a professor tells students that if they study for the tests, then there is a 55% chance they will get a B or higher on the tests. If they do not study, there is a 20% chance that they will get a B or higher on the tests. The professor knows from prior surveys that 60% of students study for the tests. The probabilities are displayed in the tree diagram.
A tree diagram. Random student to studies for test is 0.6, and to does not study for test is 0.4. Studies for test to Gets B or higher is 0.55; does not get B or higher is 0.45. Does not study for test to Gets B or higher is 0.20; does not get B or higher is 0.80.
The professor informs the class that there will be a test next week. What is the probability that a randomly selected student studied if they do not pass the test with a B or higher?
0.45
0.46
0.54
0.59

Answers: 1


Other questions on the subject: Mathematics
Mathematics, 21.06.2019 23:30, cranfordjacori
Ateam of runners is needed to run a 1 2 -mile relay race. if each runner must run 1 4 mile, how many runners will be needed?
Answers: 3
Mathematics, 21.06.2019 23:50, ChessieGiacalone
How are algebraic expressions evaluated using substitution?
Answers: 1
Mathematics, 22.06.2019 01:00, emilylittle2442
Tobias gold sells computers at the office center he's guaranteed a minimum salary of $1,959 per month plus 6.3% commission on total sales how much in total sales is he
Answers: 1
Mathematics, 22.06.2019 01:30, jude40
Asample of 200 rom computer chips was selected on each of 30 consecutive days, and the number of nonconforming chips on each day was as follows: the data has been given so that it can be copied into r as a vector. non. conforming = c(10, 15, 21, 19, 34, 16, 5, 24, 8, 21, 32, 14, 14, 19, 18, 20, 12, 23, 10, 19, 20, 18, 13, 26, 33, 14, 12, 21, 12, 27) #construct a p chart by using the following code. you will need to enter your values for pbar, lcl and ucl. pbar = lcl = ucl = plot(non. conforming/200, ylim = c(0,.5)) abline(h = pbar, lty = 2) abline(h = lcl, lty = 3) abline(h = ucl, lty = 3)
Answers: 3
Do you know the correct answer?
At the beginning of the semester, a professor tells students that if they study for the tests, then...
Questions in other subjects:

Mathematics, 14.11.2020 05:00

English, 14.11.2020 05:00
Mathematics, 14.11.2020 05:00
English, 14.11.2020 05:00

English, 14.11.2020 05:00


