

Mathematics, 02.12.2020 21:30, jose4197
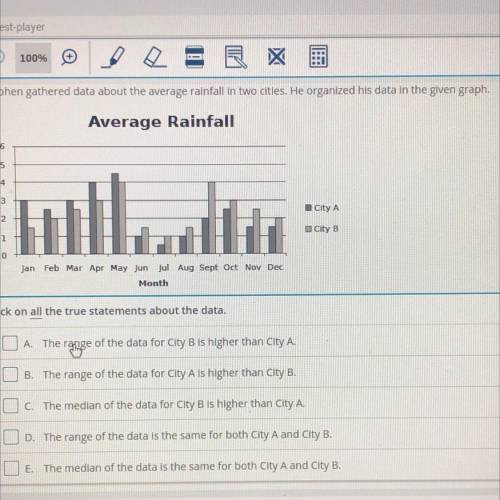
Stephen gathered data about the average rainfall in two cities. He organized his data in the given graph.
Average Rainfall
5
City A
ul.
City B
0
Jan Feb Mar Apr May Jun Jul Aug Sept Oct Nov Dec
Month
Click on all the true statements about the data.
A. The range of the data for City B is higher than City A.
B. The range of the data for City A is higher than City B.
O C. The median of the data for City B is higher than City A.
UD. The range of the data is the same for both City A and City B.
E. The median of the data is the same for both City A and City B.

Answers: 2


Other questions on the subject: Mathematics
Mathematics, 21.06.2019 13:00, Fireburntbudder
Abuyer pays a deposit to the seller in advance before completing the transaction. which term best defines this? a. down payment b. earnest money c. mortgage application fee
Answers: 1
Mathematics, 21.06.2019 15:30, jermainedwards
Divide: 1573 ÷ 7 = a) 222 r5 b) 223 r6 c) 224 r5 d) 224 r3
Answers: 2
Do you know the correct answer?
Stephen gathered data about the average rainfall in two cities. He organized his data in the given g...
Questions in other subjects:
Mathematics, 27.01.2021 07:50


Business, 27.01.2021 07:50


Physics, 27.01.2021 07:50

Geography, 27.01.2021 07:50
Business, 27.01.2021 07:50
Mathematics, 27.01.2021 07:50

Mathematics, 27.01.2021 07:50


