Mathematics, 02.12.2020 21:10, 0055babs
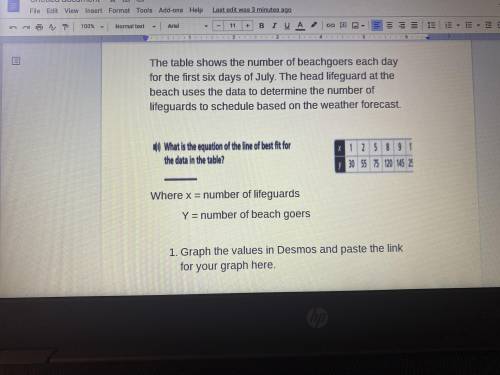
The table shows the number of beachgoers each day for the first six days of July. The head lifeguard at the beach uses the data to determine the number of lifeguards to schedule based on the weather forecast. What the equation of the line of best fit for the data in the table? 30 55 75 Where x = number of lifeguards Y = number of beach goers 1. Graph the values in Desmos and paste the link for your graph here .


Answers: 1
Other questions on the subject: Mathematics

Mathematics, 21.06.2019 16:30, happy121906
Astandard american eskimo dog has a mean weight of 30 pounds with a standard deviation of 2 pounds. assuming the weights of standard eskimo dogs are normally distributed, what range of weights would 99.7% of the dogs have? approximately 26–34 pounds approximately 24–36 pounds approximately 28–32 pounds approximately 29–31 pounds
Answers: 1


Mathematics, 22.06.2019 01:30, therealpr1metime45
Classify the following number. −9.070707…
Answers: 1
Do you know the correct answer?
The table shows the number of beachgoers each day for the first six days of July. The head lifeguard...
Questions in other subjects:


Biology, 28.01.2020 06:31

Social Studies, 28.01.2020 06:31


Computers and Technology, 28.01.2020 06:31

Chemistry, 28.01.2020 06:31


