

Mathematics, 02.12.2020 20:20, renelopez79318
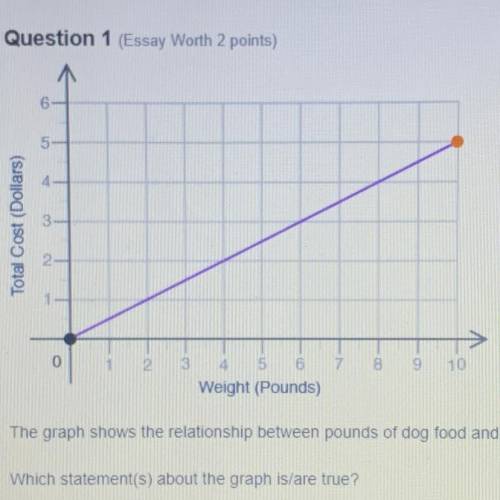
The graph shows the relationship between pounds of dog food and total cost, in dollars, for the dog food.
Which statement(s) about the graph is/are true?
A. Point(0, 0) shows the cost is $0 for 0 pound of dog food.
B. Point (1, 0.5) shows the cost is $1 for 0.5 pound of dog food.
C. Point (2, 1) shows that 2 pounds of dog food cost $1.
D. Point (4. 2) shows the cost is $4 for 2 pounds of dog food.
E. Point (10,5) shows that 10 pounds of dog food costs $5.

Answers: 3


Other questions on the subject: Mathematics
Mathematics, 21.06.2019 21:10, ttrinityelyse17
The table below shows the approximate height of an object x seconds after the object was dropped. the function h(x)= -16x^2 +100 models the data in the table. for which value of x would this model make it the least sense to use? a. -2.75 b. 0.25 c. 1.75 d. 2.25
Answers: 2
Do you know the correct answer?
The graph shows the relationship between pounds of dog food and total cost, in dollars, for the dog...
Questions in other subjects:


Social Studies, 01.07.2021 16:10
Mathematics, 01.07.2021 16:10
Mathematics, 01.07.2021 16:10
Mathematics, 01.07.2021 16:10


