

Mathematics, 02.12.2020 19:50, yeehaw777
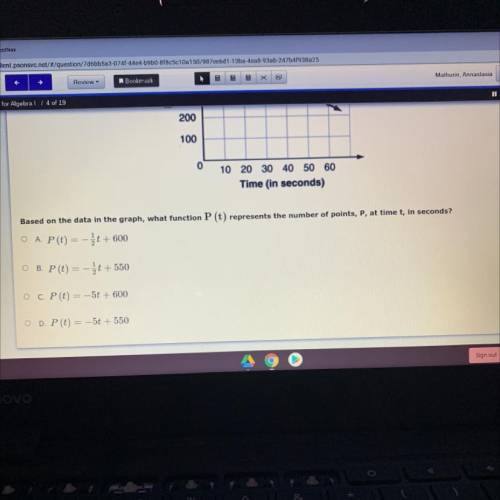
Wendy is playing a racing game. This graph shows the relationship between the time it takes Wendy to finish a race and the number of
points she earns.
Racing Game Points
600
500
400
Points
300
200
100
0
10 20 30 40 50 60
Time (in seconds)
Based on the data in the graph, what function P (t) represents the number of points, P, at time t, in seconds?

Answers: 2


Other questions on the subject: Mathematics
Mathematics, 21.06.2019 20:50, brea2006
An automobile assembly line operation has a scheduled mean completion time, μ, of 12 minutes. the standard deviation of completion times is 1.6 minutes. it is claimed that, under new management, the mean completion time has decreased. to test this claim, a random sample of 33 completion times under new management was taken. the sample had a mean of 11.2 minutes. assume that the population is normally distributed. can we support, at the 0.05 level of significance, the claim that the mean completion time has decreased under new management? assume that the standard deviation of completion times has not changed.
Answers: 3
Mathematics, 22.06.2019 03:30, davidsouth444
Calculate the mean value (expected value) of the following discrete variable x (10 points): x = 0, 1, 2, 3, 4, 5, 6 p(x) = 0.2, 0.2, 0.15, 0.15, 0.15, 0.1, 0.05
Answers: 1
Mathematics, 22.06.2019 04:30, HOTaco1837
Who ever answers this will get a cookie from batman
Answers: 1
Do you know the correct answer?
Wendy is playing a racing game. This graph shows the relationship between the time it takes Wendy to...
Questions in other subjects:


Chemistry, 02.12.2021 18:40

English, 02.12.2021 18:40

Mathematics, 02.12.2021 18:50


