


X 4.1.22
is Question Help
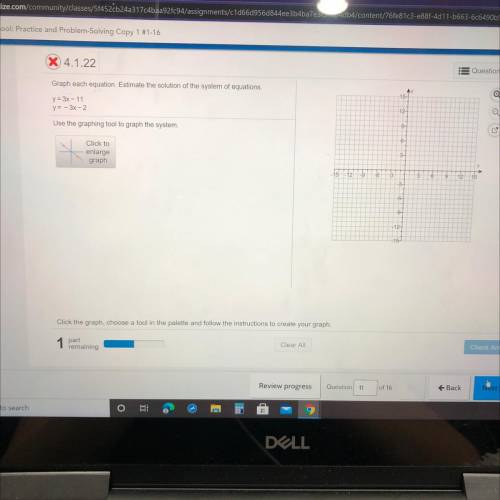
Graph each equation. Estimate the solution of the system of equatio...

Mathematics, 02.12.2020 01:00, ahoney2233
X 4.1.22
is Question Help
Graph each equation. Estimate the solution of the system of equations.
A
y = 3x - 11
y = - 3x-2
12
Use the graphing tool to graph the system.
6
Click to
enlarge
graph
3
15
-129
6
2
9
12
9
-12
Click the graph, choose a tool in the palette and follow the instructions to create your graph.
1 part
remaining
Clear All
Check Answer

Answers: 1
Other questions on the subject: Mathematics
Mathematics, 21.06.2019 20:10, jackfrost5
The population of a small rural town in the year 2006 was 2,459. the population can be modeled by the function below, where f(x residents and t is the number of years elapsed since 2006. f(t) = 2,459(0.92)
Answers: 1
Mathematics, 22.06.2019 04:30, haileywebb8
6points possible: 3. total attempts: 5 for the data shown, answer the questions. round to 2 decimal places. x 7.3 11.7 21.7 18.8 23.2 20.7 29.7 21.2 10.6 find the mean: find the median: find the standard deviation:
Answers: 2
Do you know the correct answer?
Questions in other subjects:


Social Studies, 26.02.2021 22:30
Mathematics, 26.02.2021 22:30

Health, 26.02.2021 22:30

English, 26.02.2021 22:30

Biology, 26.02.2021 22:30

History, 26.02.2021 22:30
Mathematics, 26.02.2021 22:30
Mathematics, 26.02.2021 22:30


