

Mathematics, 01.12.2020 19:00, GhostElite295
PLEASE HELP ASAP
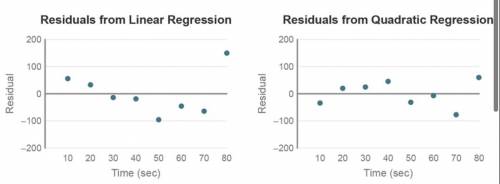
When a space shuttle takes off, it accelerates until it reaches a speed of approximately 4,400 feet per second, when its booster rockets fall off. A residual plot for a linear regression of speed on time is shown on the left, and a residual plot for a quadratic regression of speed on time is shown on the right. Based on the residual plots, which is a better model for speed as a function of time?
-Since the plot on the left shows a distinct pattern and the plot on the right does not, the linear model is more appropriate.
-Since the plot on the left shows a distinct pattern and the plot on the right does not, the nonlinear model is more appropriate.
-Since the plot on the right shows a distinct pattern and the plot on the left does not, the linear model is more appropriate.
-Since the plot on the right shows a distinct pattern and the plot on the left does not, the nonlinear model is more appropriate.
-Since both plots show a distinct pattern, neither model is appropriate.

Answers: 1


Other questions on the subject: Mathematics
Mathematics, 21.06.2019 15:00, gghkooo1987
This is the number of parts out of 100, the numerator of a fraction where the denominator is 100. submit
Answers: 3
Mathematics, 21.06.2019 23:30, ayoismeisalex
In order for the function to be linear, what must m be and why? m = 22 because the rate of change is 1. m = 20 because the rate of change is 3. m = 22 because the rate of change is -1. m = 20 because the rate of change is -3.
Answers: 2
Mathematics, 22.06.2019 00:00, jhenifelix
Cd is the perpendicular bisector of both xy and st, and cy=20. find xy.
Answers: 1
Do you know the correct answer?
PLEASE HELP ASAP
When a space shuttle takes off, it accelerates until it reaches a speed of approxi...
Questions in other subjects:

Physics, 29.04.2021 22:10

Mathematics, 29.04.2021 22:10

English, 29.04.2021 22:10

Mathematics, 29.04.2021 22:10

English, 29.04.2021 22:10


