


Part A
The prices of 12 different types of cereal rounds to the near test dollar are shown. Wh...

Mathematics, 30.11.2020 18:50, giselabarajas24
Part A
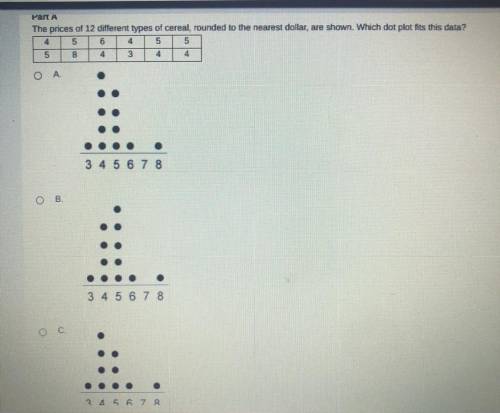
The prices of 12 different types of cereal rounds to the near test dollar are shown. Which dot plot fits this data?
A.
B.
C.
Part B
Cereal Brand X costs $3. Use the data from Part A. Which description of Brand X is most accurate?
A. Brand X costs more than the median price of the cereals in the plot.
B. Brand X is an outlier for the data set.
C. The price of Brand C is the same as the price that was recorded most often.
Brand X costs about a dollar less than the price that was recorded most often.

Answers: 2
Other questions on the subject: Mathematics
Mathematics, 21.06.2019 20:30, aaronw3743
Wrote and expression for the difference of p and 4
Answers: 1
Mathematics, 21.06.2019 23:30, awsomeboy12345678
Harry the hook has 7 1/3 pounds of cookie dough. she uses 3/5 of it to bake cookie. how much cookie dough does she use to make cookie?
Answers: 1
Do you know the correct answer?
Questions in other subjects:


Business, 14.07.2019 18:00


