


The graph below represents a population
over time. What is the average rate of
change for the...

Mathematics, 30.11.2020 06:20, person6764
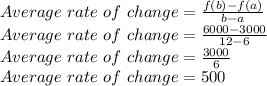
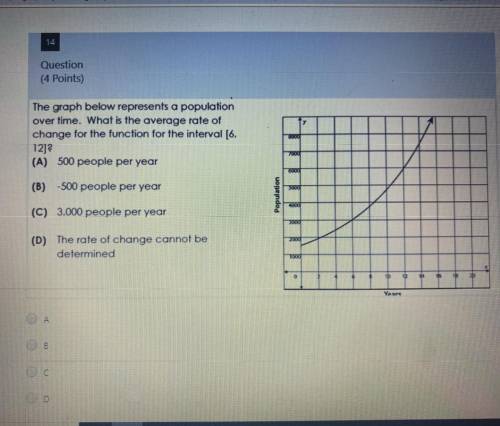
The graph below represents a population
over time. What is the average rate of
change for the function for the interval (6, 12]?
PLS HELP

Answers: 2
Other questions on the subject: Mathematics
Mathematics, 21.06.2019 22:00, jacksonshalika
Billie holiday sells children's clothing for sara vaughn's toddler shop. baby blankets sell for $29.99 after a markup rate based on cost of 109%. find the cost and the markup.
Answers: 2
Mathematics, 22.06.2019 00:40, seiglersteven99
Ican interpret and represent the remainder in division calculations sensibly for the context (eg 27.4 in calculating average height in cm: $27.44 if it represents an amount of money) solve the following problems. 15) the wildlife park charges $25.50 dollars per person to enter their park if the park made $15096 dollars today, how many people entered the park? 16) ms adams plus 2,230 other keen runners ran a marathon: between them they ran 94817.5km. how many km did each competitor run?
Answers: 1
Do you know the correct answer?
Questions in other subjects:

Mathematics, 17.09.2019 21:30

English, 17.09.2019 21:30
Mathematics, 17.09.2019 21:30
Mathematics, 17.09.2019 21:30


