

Mathematics, 29.11.2020 02:30, SmokeyRN
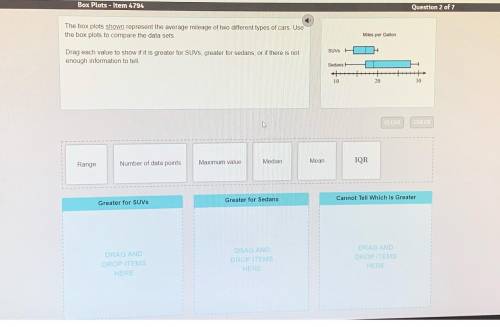
The box plots shown represent the average mileage of two different types of cars. Use the box plots to compare the data sets. Drag each value to show if it is greater for SUVs, greater for sedans, or if there is not enough information to tell.

Answers: 2


Other questions on the subject: Mathematics
Mathematics, 21.06.2019 19:00, breannaasmith1122
Which of the expressions (on the photo document i inserted) together represent all solutions to the following equation? 8cos(12x)+4=-4 *the answer should be in degrees.* > i would like for someone to explain the process to find the solutions for this.
Answers: 2
Mathematics, 22.06.2019 02:50, makalanharrison
04.05 graphing exponential functions write an exponential function to represent the spread of bens social media post
Answers: 1
Do you know the correct answer?
The box plots shown represent the average mileage of two different types of cars. Use the box plots...
Questions in other subjects:

Business, 27.06.2021 20:40

Physics, 27.06.2021 20:40

Business, 27.06.2021 20:40

Biology, 27.06.2021 20:40


