


Which linear inequality is represented by the graph?
y < 3x + 2
y> 3x + 2
20, 2)<...

Mathematics, 26.11.2020 07:10, ashbromail
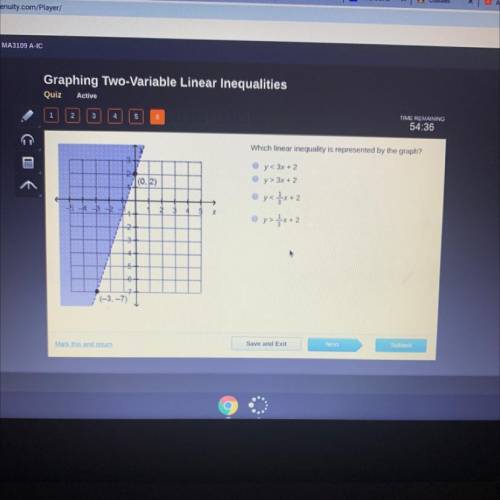
Which linear inequality is represented by the graph?
y < 3x + 2
y> 3x + 2
20, 2)
2 3 4
0 x< 1 / 3x + 2
Oy> {x+2
5
х
-5+
(-3,-7)
Mark this and return
Save and Exit
Next
Submit

Answers: 1
Other questions on the subject: Mathematics
Mathematics, 21.06.2019 17:40, PONBallfordM89
How can the correlation in the scatter plot graph below best be described? positive correlation negative correlation both positive and negative no correlation
Answers: 1
Mathematics, 21.06.2019 19:00, dfrtgyuhijfghj4794
Since opening night, attendance at play a has increased steadily, while attendance at play b first rose and then fell. equations modeling the daily attendance y at each play are shown below, where x is the number of days since opening night. on what day(s) was the attendance the same at both plays? what was the attendance? play a: y = 8x + 191 play b: y = -x^2 + 26x + 126 a. the attendance was never the same at both plays. b. the attendance was the same on day 5. the attendance was 231 at both plays on that day. c. the attendance was the same on day 13. the attendance was 295 at both plays on that day. d. the attendance was the same on days 5 and 13. the attendance at both plays on those days was 231 and 295 respectively.
Answers: 1
Do you know the correct answer?
Questions in other subjects:

Computers and Technology, 10.03.2020 03:32


