

Mathematics, 25.11.2020 22:30, lazybridplayer
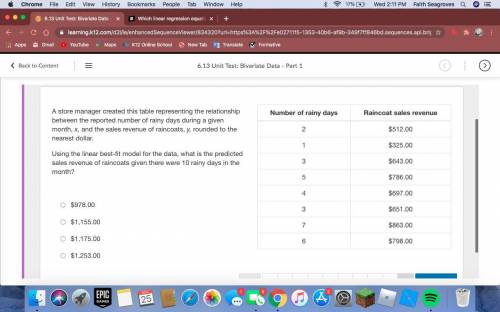
A store manager created this table representing the relationship between the reported number of rainy days during a given month, x, and the sales revenue of raincoats, y, rounded to the nearest dollar.
Using the linear best-fit model for the data, what is the predicted sales revenue of raincoats given there were 10 rainy days in the month?
$978.00
$1,155.00
$1,175.00
$1,253.00

Answers: 1


Other questions on the subject: Mathematics
Mathematics, 21.06.2019 12:40, cindyroxana229
Which shows the image of rectangle abcd after the rotation (x, y) → (–y, x)?
Answers: 3
Mathematics, 21.06.2019 15:30, Leggett3146
On the first of each month, shelly runs a 5k race. she keeps track of her times to track her progress. her time in minutes is recorded in the table: jan 40.55 july 35.38 feb 41.51 aug 37.48 mar 42.01 sept 40.87 apr 38.76 oct 48.32 may 36.32 nov 41.59 june 34.28 dec 42.71 determine the difference between the mean of the data, including the outlier and excluding the outlier. round to the hundredths place. 39.98 39.22 0.76 1.21
Answers: 1
Mathematics, 21.06.2019 18:50, adriana145
The trigonometric ratios sine and secant are reciprocals of each other
Answers: 2
Mathematics, 21.06.2019 20:30, ellie55991
Graph the line that represents a proportional relationship between d and t with the property that an increase of 33 units in t corresponds to an increase of 44 units in d. what is the unit rate of change of dd with respect to t? (that is, a change of 11 unit in t will correspond to a change of how many units in d? )
Answers: 3
Do you know the correct answer?
A store manager created this table representing the relationship between the reported number of rain...
Questions in other subjects:

Mathematics, 17.07.2019 09:30

History, 17.07.2019 09:30

Computers and Technology, 17.07.2019 09:30


Biology, 17.07.2019 09:30
Mathematics, 17.07.2019 09:30


