

Mathematics, 27.09.2019 15:10, bad32
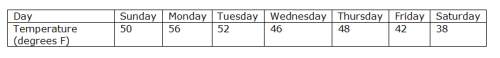
Julia measured the high temperature in her town for one week. using the chart below, find the mean absolute deviation for the high temperatures.
be sure to show your work for finding:
the mean of the set of data
the distance of each number from the mean
the mean absolute deviation

Answers: 2


Other questions on the subject: Mathematics
Mathematics, 21.06.2019 20:00, cielo2761
The table below represents a linear function f(x) and the equation represents a function g(x): x f(x) −1 −5 0 −1 1 3 g(x) g(x) = 2x − 7 part a: write a sentence to compare the slope of the two functions and show the steps you used to determine the slope of f(x) and g(x). (6 points) part b: which function has a greater y-intercept? justify your answer. (4 points)
Answers: 2
Do you know the correct answer?
Julia measured the high temperature in her town for one week. using the chart below, find the mean a...
Questions in other subjects:


English, 15.05.2021 02:40


Chemistry, 15.05.2021 02:40


