

Mathematics, 25.11.2020 02:00, kyleee1991
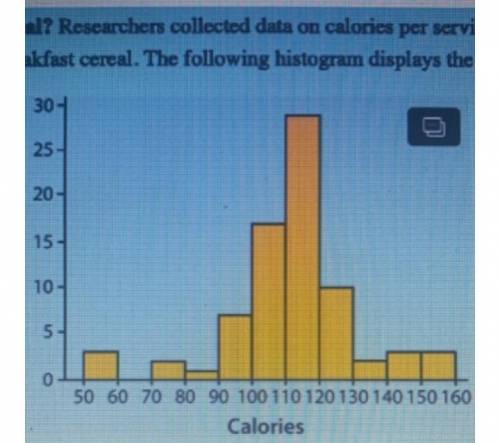
Researchers collected data on calories per serving for 77 brands of breakfast cereal. The histogram displays the data
30
25-
20
1
Frequency
15
What is the approximate center of this distribution?
The center of the distribution is between 120 and 130
calories.
The center of the distribution is between 90 and 100
calories.
The center of the distribution is between 110 and 120
calories.
The center of the distribution is between 80 and
90 calories.
The center of the distribution is between 130 and 140
calories.
10
-
50 60 70 80 90 100 110 120 130 140 150 160
Calories

Answers: 3


Other questions on the subject: Mathematics
Mathematics, 20.06.2019 18:02, channarlawassociate
Irene bought 3 yards of fabric and a spool of thread for $28.10. if the spool of thread cost $1.25, how much did the fabric cost per yard?
Answers: 2
Mathematics, 21.06.2019 12:30, frankgore7836
Can someone 50 first drop menu 0.80 or 0.75 or 1.20 or 4.00 second drop menu 4.00 or 0.75 or 0.25 or 3.75 3rd 15,6,10, or 9 4th yes or no
Answers: 1
Mathematics, 21.06.2019 13:20, Delgadojacky0206
At school there are 526 students and 263 are girls about how likely is it that a randomly chosen student will be a boy
Answers: 2
Do you know the correct answer?
Researchers collected data on calories per serving for 77 brands of breakfast cereal. The histogram...
Questions in other subjects:

History, 26.02.2021 21:10
Mathematics, 26.02.2021 21:10

Mathematics, 26.02.2021 21:10
Mathematics, 26.02.2021 21:10
Biology, 26.02.2021 21:10


