

Mathematics, 24.11.2020 23:10, Lonzo2
I NEED HELP ASAP
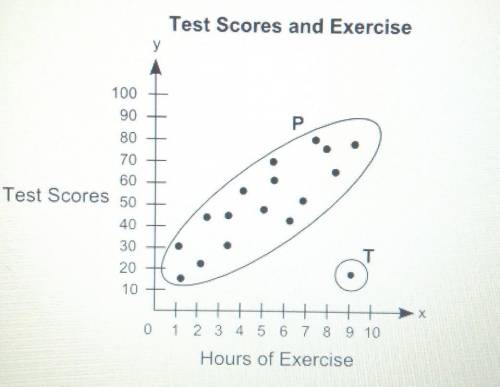
The scatter plot shows the relationship between the test scores of a group of students and the number of hours they exercise in a week:
Part A: What is the group of points labeled P called? What is the point labeled T called? Give a possible reason for the presence of point T.
Part B: Describe the association between students' test scores and the number of hours they exercise.

Answers: 3


Other questions on the subject: Mathematics
Mathematics, 21.06.2019 17:00, ayoismeisalex
Describe what moves you could use to create the transformation of the original image shown at right
Answers: 1
Mathematics, 21.06.2019 17:00, burritomadness
If a baby uses 15 diapers in 2 days, how many diapers will the baby use in a year?
Answers: 2
Do you know the correct answer?
I NEED HELP ASAP
The scatter plot shows the relationship between the test scores of a group of stud...
Questions in other subjects:


Mathematics, 26.06.2019 15:30


History, 26.06.2019 15:30
Mathematics, 26.06.2019 15:30
Biology, 26.06.2019 15:30
Mathematics, 26.06.2019 15:30


