

Mathematics, 23.11.2020 03:50, andrew8228
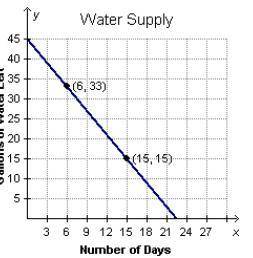
The graph shows the amount of water that remains in a barrel after it begins to leak. The variable x represents the number of days that have passed since the barrel was filled, and y represents the number of gallons of water that remain in the barrel. What does the y-intercept represent?
A. the amount of water that is added to the barrel each day
B. the amount of water that remains in the water barrel
C. the amount of water that is initially in the water barrel
D. the amount that the water barrel decreases each day

Answers: 2


Other questions on the subject: Mathematics
Mathematics, 21.06.2019 17:00, cordovatierra16
Which graph corresponds to the function f(x) = x2 + 4x – 1?
Answers: 1
Do you know the correct answer?
The graph shows the amount of water that remains in a barrel after it begins to leak. The variable x...
Questions in other subjects:


Mathematics, 04.12.2019 22:31
Mathematics, 04.12.2019 22:31

English, 04.12.2019 22:31


