

Mathematics, 22.11.2020 23:40, ramondoss249
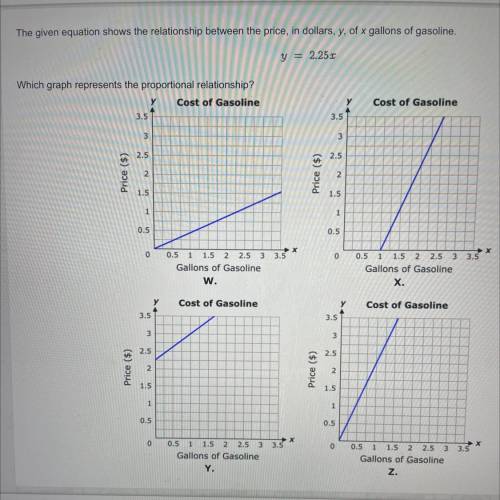
The given equation shows the relationship between the price, in dollars, y, of x gallons of gasoline.
y = 2.251
Which graph represents the proportional relationship?
Cost of Gasoline
3.5
Cost of Gasoline
3.5
3
3
2.5
2.5
Price ($)
2
Price ($)
2
1.5
1.5
1
1
0.5
0.5
0
0
0.5 1 1.5 2 2.5 3 3.5
Gallons of Gasoline
w.
0.5 1 1.5 2 2.5 3 3.5
Gallons of Gasoline
X.
Cost of Gasoline
Cost of Gasoline
Y
3.5
3.5
3
3
2.5
2.5
Price ($)
2
Price ($)
2
1.5
1.5
1
1
0.5
0.5
0
0
0.5 1 1.5 2 2.5
1.5 2 2.5 3 3.5
Gallons of Gasoline
Y.
0.5 1 1.5 2
1.5 2 2.5 3 3.5
Gallons of Gasoline
z.
1 of 10 Answered
Session Score: 0% (0/1)

Answers: 1


Other questions on the subject: Mathematics
Mathematics, 22.06.2019 01:30, jasminespets
What is the surface area of a cube with the volume of 729 ft?
Answers: 1
Mathematics, 22.06.2019 01:50, lcyaire
Me asap the graph shows the relationship between the price of frozen yogurt and the number of ounces of frozen yogurt sold at different stores and restaurants according to the line of best fit about how many ounces of frozen yogurt can someone purchase for $5? 1 cost of frozen yogurt 1.5 2 13 15.5 cost (5) no 2 4 6 8 10 12 14 16 18 20 size (oz)
Answers: 1
Mathematics, 22.06.2019 03:30, kellynadine02
What is the distance between (3,k+1) and (2k, k-1)
Answers: 1
Do you know the correct answer?
The given equation shows the relationship between the price, in dollars, y, of x gallons of gasoline...
Questions in other subjects:
Mathematics, 08.12.2019 16:31
Mathematics, 08.12.2019 16:31


History, 08.12.2019 16:31


Chemistry, 08.12.2019 16:31


