


The
The table shows the average daily number of hours sleep of 10 children.
Age (years)
...

Mathematics, 22.11.2020 01:00, isabellatagaban
The
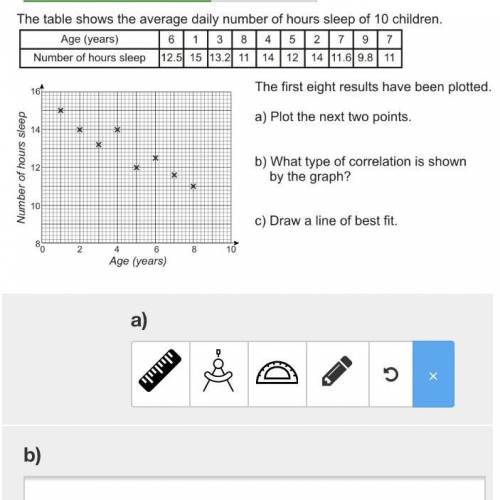
The table shows the average daily number of hours sleep of 10 children.
Age (years)
6 1 3 8 4 5 2 7 9 7
Number of hours sleep 12.5 15 13.2 11 14 12 14 11.69.8 11
The first eight results have been plotted.
a) Plot the next two points.
x
Number of hours sleep
b) What type of correlation is shown
by the graph? Negative
10
c) Draw a line of best fit.
2
4
6
8
10
Age (years)
Please help.

Answers: 1
Other questions on the subject: Mathematics
Mathematics, 21.06.2019 15:30, hannahking1869
Which conjunction is disjunction is equivalent to the given absolute value inequality? |x+2|< 18
Answers: 1
Mathematics, 22.06.2019 02:00, divagothboi
Thirteen bowlers were asked what their score was on their last game. the scores are shown below 190,150,154,194,181,190,170,151,170 ,178,161,180 find the range of the bowlers score a.56 b.44 c.34 d.23
Answers: 1
Do you know the correct answer?
Questions in other subjects:


Spanish, 16.12.2020 20:10

Advanced Placement (AP), 16.12.2020 20:10
Mathematics, 16.12.2020 20:10


Chemistry, 16.12.2020 20:10


