


Find measure of the angle - Please help for a test review today!!!
...

Mathematics, 20.11.2020 17:30, dianamunoz580
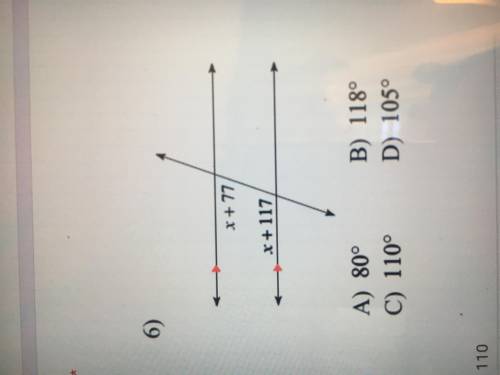
Find measure of the angle - Please help for a test review today!!!

Answers: 2
Other questions on the subject: Mathematics
Mathematics, 21.06.2019 15:30, superstarsara5ouh83x
Write an equation of a line in slope intercept form that is perpendicular to the line 2x -3y = 12 and passes through the point (2, 6).
Answers: 3
Mathematics, 21.06.2019 19:00, carterkelley12oz0kp1
This task builds on important concepts you've learned in this unit and allows you to apply those concepts to a variety of situations. the task has several parts, each in its own section. mr. hill's seventh grade math class has been learning about random sampling and how it tends to produce samples that are representative of an entire population. they've also learned that if a sample is representative of the entire population, then estimates or predictions made based on the sample usually apply to the population as well. today, in class, they are also learning about variation in random sampling. that, although predictions and estimates about the population can be made from a random sample, different random samples will often produce slightly different predictions or estimates. to demonstrate this concept to his students, mr. hill is going to use simulation. he begins the lesson by explaining to the class that a certain university in the united states has a student enrollment of 19,100. mr. hill knows the percentage of students that are male and the percentage of students that are female. using simulation and random sampling, he wants his seventh grade students to estimate both the percentage of male students and the number of male students that are enrolled in this university. to conduct the simulation, mr. hill has placed one hundred colored chips in a bag, using the appropriate percentages of enrolled male and female university students. red chips represent males, and yellow chips represent females. each seventh grade student will randomly select twenty chips, record the colors they selected, and put the chips back in the bag. at this point, each seventh grade student will only know the results of their own random sample. before you begin, it's a good idea to look over each part to get oriented to the whole task. additionally, it's best to complete the sections in order, since they build on each other. finally, the work you complete will be a combination of computer-graded problems and written work that your teacher will grade. in some cases, you will need to complete work outside of the problem (in a word processing document or on paper, for example) and upload it for grading. to get started click work on questions. questions: 1. suppose a student reaches in the bag and randomly selects nine red chips and eleven yellow chips. based on this sample, what is a good estimate for the percentage of enrolled university students that are male? 2. suppose a student reaches in the bag and randomly selects nine red chips and eleven yellow chips. based on this sample, what is a good estimate for the number of enrolled university students that are male? 3. suppose a different student reaches in the bag, randomly selects their twenty chips, and estimates that 60% of the students are male. how many yellow chips were in their sample? 4. suppose a different student reaches in the bag, randomly selects their twenty chips, and estimates that 60% of the students are male. based on this sample, what is a good estimate for the number of enrolled university students that are female? 5. based on your dot plot, make a new estimate of both the percentage and number of males that attend this university. use complete sentences in your answer and explain your reasoning. 6. compare your estimates for the percentage of male university students from part a and part b. which estimate do you think is more representative of the population? use complete sentences in your answer and explain your reasoning. 7. once you have created both sets of numbers, complete the following tasks. in each task, make sure to clearly label which set you are identifying or describing. identify the elements of each set that you created. calculate the mean of each set. show your work in your answer. calculate the mean absolute deviation of each set. show your work in your answer. describe the process you used to create your sets of numbers under the given conditions.
Answers: 1
Mathematics, 21.06.2019 23:00, Hakika
In january 2010, you began a one-year study of tuberculosis (tb) in a subsidized housing community in the lower east side of new york city. you enrolled 500 residents in your study and checked on their tb status on a monthly basis. at the start of your study on january 1st, you screened all 500 residents. upon screening, you found that 30 of the healthy residents had been vaccinated for tb and therefore were not at risk. another 20 residents already had existing cases of tb on january 1st. on february 1st, 5 residents developed tb. on april 1st, 10 more residents developed tb. on june 1st, 10 healthy residents moved away from new york city and were lost to follow-up. on july 1st, 10 of the residents who had existing tb on january 1st died from their disease. the study ended on december 31, 2010. assume that once a person gets tb, they have it for the duration of the study, and assume that all remaining residents stayed healthy and were not lost to follow-up. is the subsidized housing community in the lower east side of new york city a dynamic or fixed population? briefly explain the rationale for your answer. dynamic population it can changeable people can move out and move in into the population of a subsidized housing what was the prevalence of tb in the screened community on january 1st? prevalence = 30/500 0.06= 6% what was the prevalence of tb on june 30th? prevalence= 40/450=0.08= 8.88% what was the cumulative incidence of tb over the year? cumulative incidence = number of new cases/number in candidate population)over specified time period 10/450 = 2.2% suppose that you wanted to calculate the incidence rate of tb in the study population. calculate the amount of person-time that would go in the denominator of this incidence rate. be sure to show your work.
Answers: 2
Do you know the correct answer?
Questions in other subjects:


Mathematics, 01.07.2020 15:01

Mathematics, 01.07.2020 15:01

Spanish, 01.07.2020 15:01
History, 01.07.2020 15:01


