


Two different age groups were surveyed about
the amount of time they spent on social media,
T...

Mathematics, 19.11.2020 21:50, bmartinez26
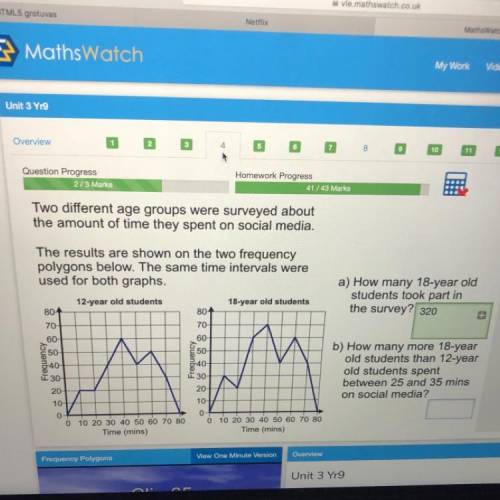
Two different age groups were surveyed about
the amount of time they spent on social media,
The results are shown on the two frequency
polygons below. The same time intervals were
used for both graphs,
a) How many 18-year old
students took part in
12 year old students
18-year old students
801
801
the survey?
70
70-4
60
50
b) How many more 18-year
840
old students than 12-year
old students spent
20
between 25 and 35 mins
10
10-
on social media?
0
0
0 10 20 30 40 50 60 70 80 0 10 20 30 40 50 60 70 80
Time (mins)
Time (mins)
80
50
Frequency
Frequency
M.
Ģ40
30
30
20

Answers: 3
Other questions on the subject: Mathematics
Mathematics, 21.06.2019 19:00, datands
Acompany that manufactures and sells guitars made changes in their product range. from the start they had 20 models. then they reduced the number of models to 15. as a result, the company enjoyed a 10% increase in turnover. - how much did the stock level change? in (%)
Answers: 2
Do you know the correct answer?
Questions in other subjects:

History, 19.11.2019 13:31
Mathematics, 19.11.2019 13:31
Mathematics, 19.11.2019 13:31


Mathematics, 19.11.2019 13:31
Mathematics, 19.11.2019 13:31


