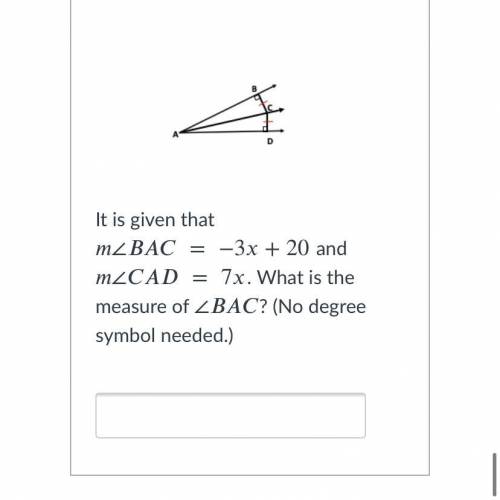
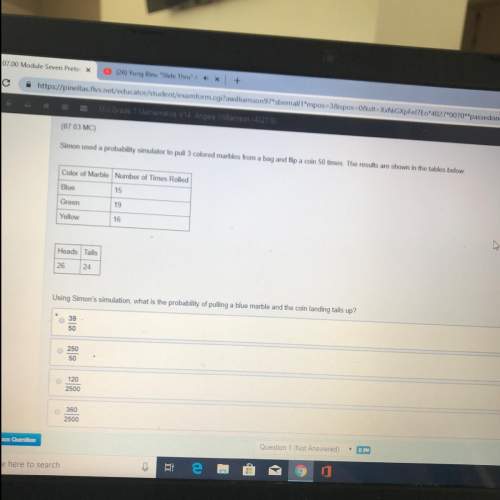
Need help with this. Please
...

Answers: 3
Other questions on the subject: Mathematics

Mathematics, 21.06.2019 17:00, burgoonp
Me on this one i will give you 20pts. answer should be in detail . this is the discussion topic. one of the most fiercely debated topics in sports is the hot hand theory. the hot hand theory says that success breeds success. in other words, rather than each shot a basketball player takes or each at-bat a baseball player has being an independent event, the outcome of one event affects the next event. that is, a player can get hot and make a lot of shots in a row or get a lot of hits in a row. the hot hand theory, however, has been shown to be false in numerous academic studies. read this article, which discusses the hot hand theory as it relates to a professional basketball player. state whether you agree or disagree with the hot hand theory, and give reasons for your opinion. be sure to use some of the terms you’ve learned in this unit, such as independent event, dependent event, and conditional probability, in your answer.
Answers: 2

Mathematics, 21.06.2019 22:00, iamsecond235p318rq
Find the greatest common factor of the followig monomials 46g^2h and 34g^6h^6
Answers: 1

Mathematics, 21.06.2019 22:20, KillerSteamcar
Which strategy is used by public health to reduce the incidence of food poisoning?
Answers: 2

Mathematics, 22.06.2019 03:00, dominiqueallen23
Describe how the presence of possible outliers might be identified on the following. (a) histograms gap between the first bar and the rest of bars or between the last bar and the rest of bars large group of bars to the left or right of a gap higher center bar than surrounding bars gap around the center of the histogram higher far left or right bar than surrounding bars (b) dotplots large gap around the center of the data large gap between data on the far left side or the far right side and the rest of the data large groups of data to the left or right of a gap large group of data in the center of the dotplot large group of data on the left or right of the dotplot (c) stem-and-leaf displays several empty stems in the center of the stem-and-leaf display large group of data in stems on one of the far sides of the stem-and-leaf display large group of data near a gap several empty stems after stem including the lowest values or before stem including the highest values large group of data in the center stems (d) box-and-whisker plots data within the fences placed at q1 â’ 1.5(iqr) and at q3 + 1.5(iqr) data beyond the fences placed at q1 â’ 2(iqr) and at q3 + 2(iqr) data within the fences placed at q1 â’ 2(iqr) and at q3 + 2(iqr) data beyond the fences placed at q1 â’ 1.5(iqr) and at q3 + 1.5(iqr) data beyond the fences placed at q1 â’ 1(iqr) and at q3 + 1(iqr)
Answers: 1
Do you know the correct answer?
Questions in other subjects:


Mathematics, 12.01.2021 01:00

Mathematics, 12.01.2021 01:00

Social Studies, 12.01.2021 01:00

Mathematics, 12.01.2021 01:00

Biology, 12.01.2021 01:00


Mathematics, 12.01.2021 01:00


