

Mathematics, 19.11.2020 17:50, kvivas54
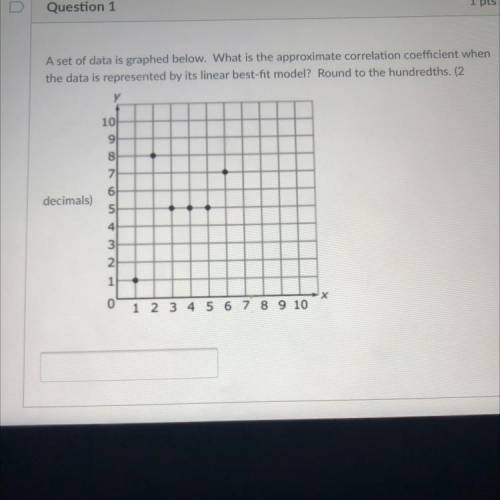
A set of data is graphed below. What is the approximate correlation coefficient when
the data is represented by its linear best-fit model? Round to the hundredths. (2
decimals

Answers: 1


Other questions on the subject: Mathematics
Mathematics, 21.06.2019 17:00, valeriekbueno
100 points, hi, i’m not sure how to get the equation from the graph and table.
Answers: 2
Mathematics, 21.06.2019 23:20, coralstoner6793
This graph shows which inequality? a ≤ –3 a > –3 a ≥ –3 a < –3
Answers: 1
Mathematics, 21.06.2019 23:40, kamdenburr
Sanjay solved the equation below. which property did he use to determine that 7x+42=42 is equivalent to 7(x+6)=42 7x+42=42 7x=0 x=0
Answers: 1
Do you know the correct answer?
A set of data is graphed below. What is the approximate correlation coefficient when
the data is re...
Questions in other subjects:
Mathematics, 02.03.2021 04:10


